Zoom price breaches neckline of double top pattern - Forecast today - 11-06-2026
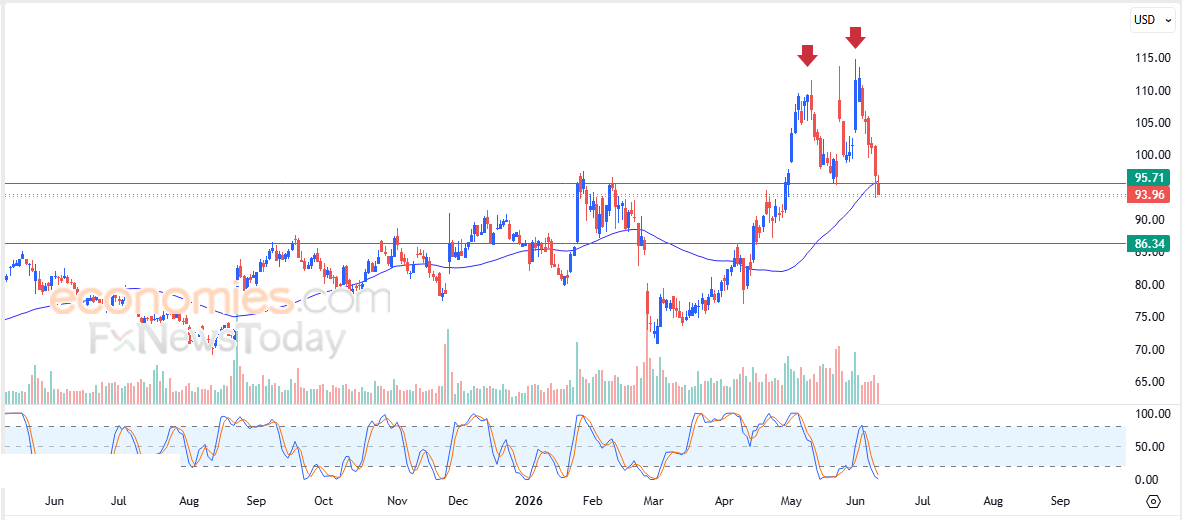
Zoom Video Communications (ZM) stock price continued to decline in its latest intraday trading, breaking below the key support level at $95.70. This level represented the neckline of a bearish technical formation that developed over the short term, namely a double-top pattern. The breakdown has exposed the stock to increased negative pressure, particularly as it coincided with a move below its 50-day SMA. In the background, negative signals continue to emerge from the Stochastic indicators, reinforcing the bearish outlook.
Therefore we expect the stock price to decline in its upcoming trading, especially as long as it remains below the $95.70 level, targeting the first support level at $86.35.
Today’s price forecast: Bearish.
CVS price attacks pivotal resistance - Forecast today - 11-06-2026
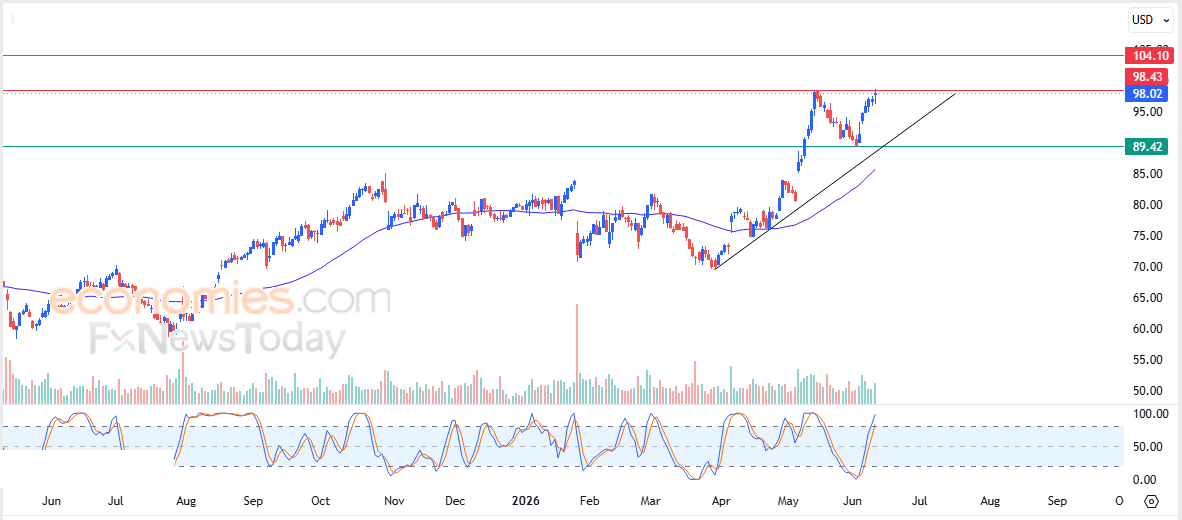
CVS Health Corporation (CVS) stock price continued to advance in its latest intraday trading, as the stock challenges the key resistance level at $98.40. The move is supported by positive dynamic support from trading above its 50-day SMA, which reinforces the stability and dominance of the main short-term bullish trend, while the stock continues to move alongside a secondary trend line supporting this path. In addition, positive signals continue to emerge from the Stochastic indicators.
Therefore we expect the stock price to rise in its upcoming trading, especially if it succeeds in breaking above the $98.40 resistance level, targeting the next resistance level at $104.00.
Today’s price forecast: Bullish.
eBay price leans on SMA support - Forecast today - 11-06-2026
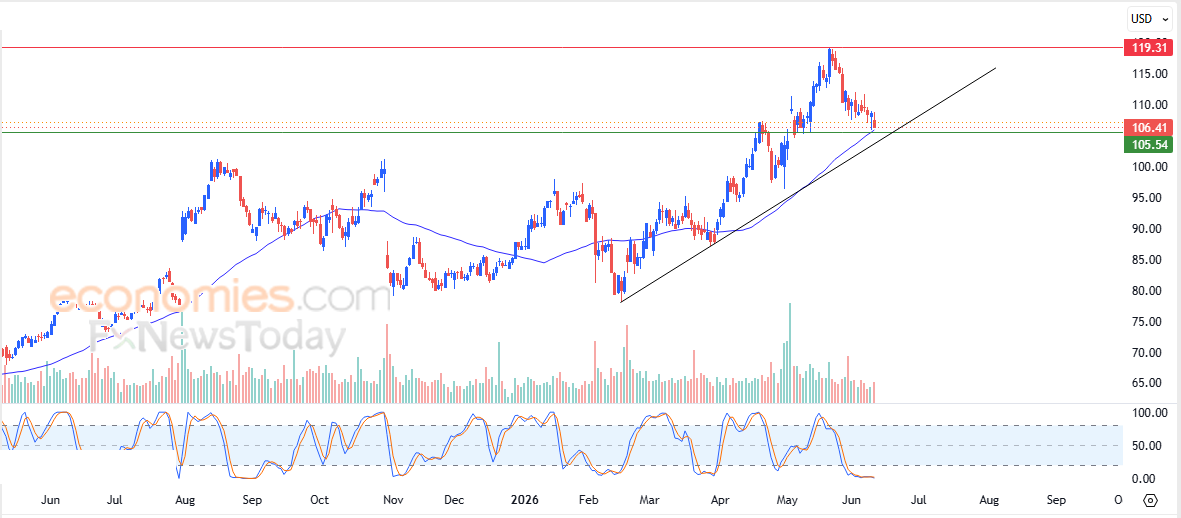
eBay Inc. (EBAY) stock price declined in its latest intraday trading as the stock attempts to establish a higher low that could serve as a base for building the positive momentum needed to recover and move higher again. The recent pullback has brought the stock down to the support of its 50-day SMA. Meanwhile, the Stochastic indicators have reached deeply oversold levels in an exaggerated manner compared to the stock’s price action, suggesting the formation of a positive divergence that could strengthen the prospects for a near-term recovery. This comes while the main short-term trend remains bullish, with the stock continuing to move alongside a secondary trend line supporting this path.
Therefore we expect the stock price to rise in its upcoming trading, provided that the $105.50 support level remains intact, targeting the $119.00 resistance level.
Today’s price forecast: Bullish.
Forecast update for Ethereum -11-06-2026
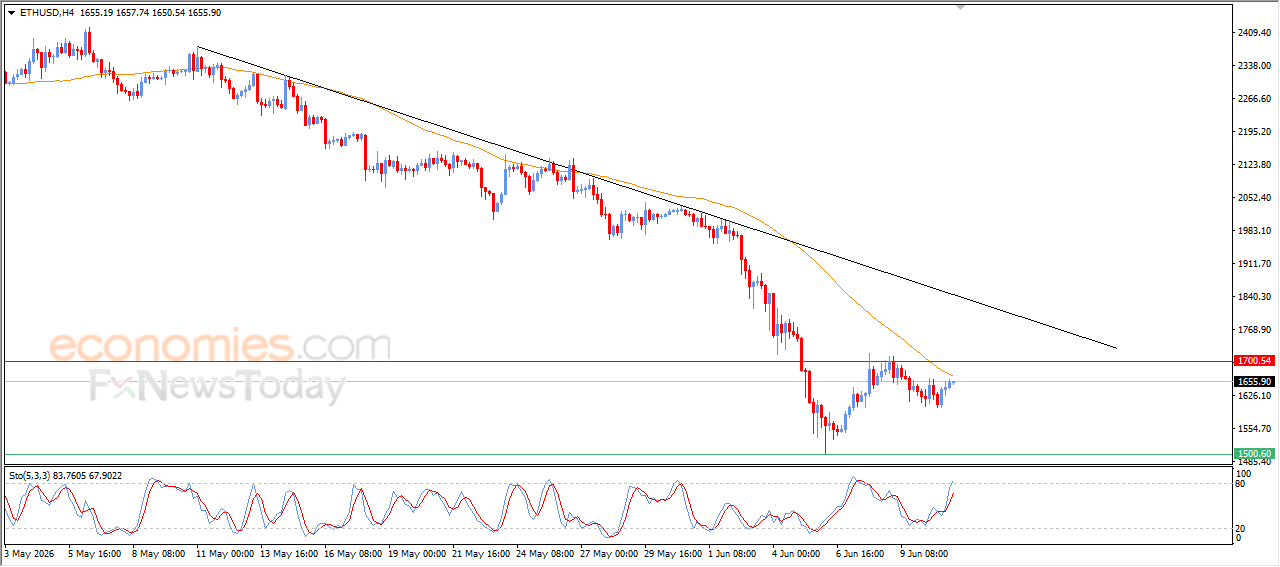
Ethereum (ETHUSD) rose during its latest intraday trading sessions, supported by the emergence of the positive signals from the relative strength indicators, reaching EMA50’s resistance, putting it under negative pressure and causing severe rebound, especially that the relative strength indicators reached overbought levels, amid the dominance of the main bearish trend, with its trading alongside supportive trend line for this path.