Wells Fargo price extends cautious gains - Forecast today - 07-04-2026
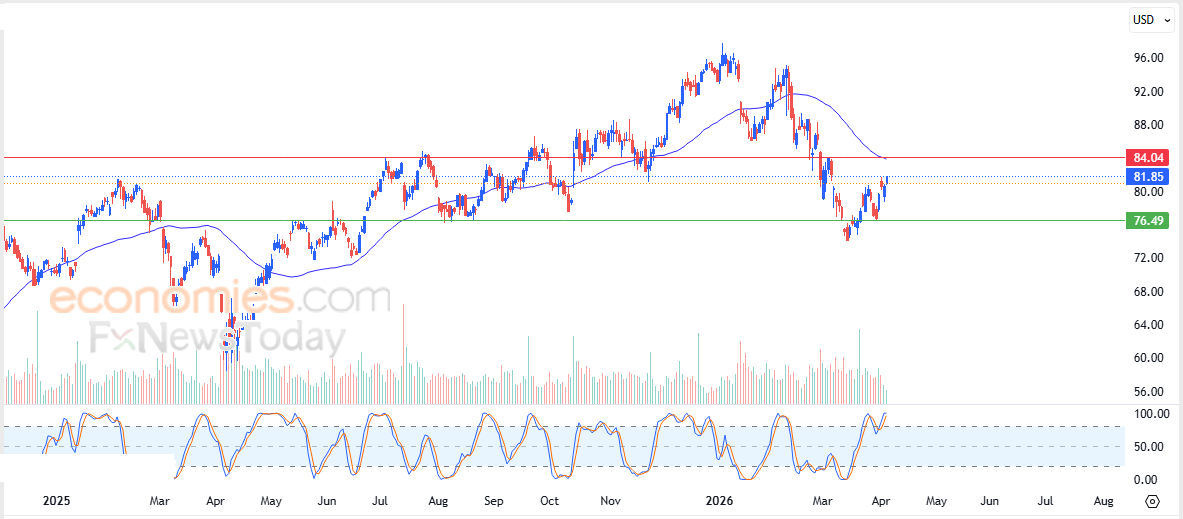
Wells Fargo & Company (WFC) stock price recorded gains in its latest intraday trading, driven by positive signals emerging from the Stochastic indicator. However, we note that the indicator has reached extremely overbought levels, which are excessive relative to price action, signaling a rapid loss of the positive momentum surrounding the stock. This occurs amid the dominance of a short-term corrective bearish wave, with continued negative pressure from trading below its 50-day SMA, limiting the chances of a full recovery for the stock in the near term.
Therefore we expect the stock price to decline during its upcoming trading sessions, as long as resistance at $84.00 remains intact, targeting the support level at $76.50.
Today’s price forecast: Bearish
Forecast update for Ethereum -07-04-2026
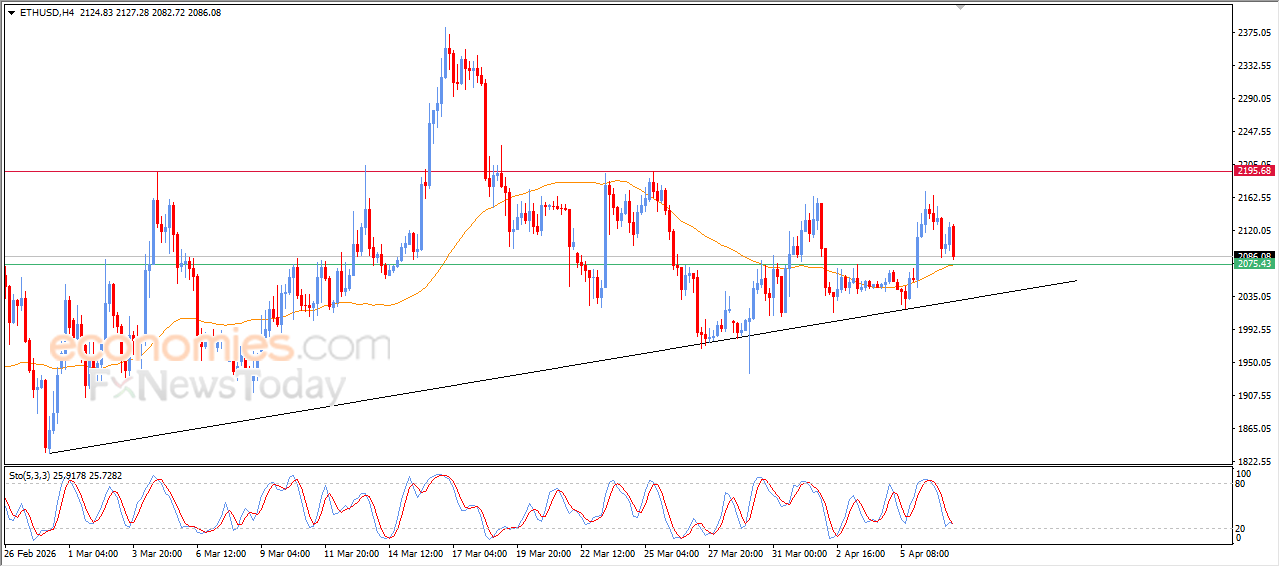
Ethereum price declined during its recent intraday trading, finding support at EMA50. This marks a final attempt by the price to gain positive momentum that could help it recover and move higher again.
This comes within the context of a dominant short-term bullish trend, alongside the early formation of a positive divergence on the relative strength indicators, after the indicator reached deeply oversold levels compared to price action. This is supported by the beginning of a bullish crossover.
Forecast update for Brent -07-04-2026
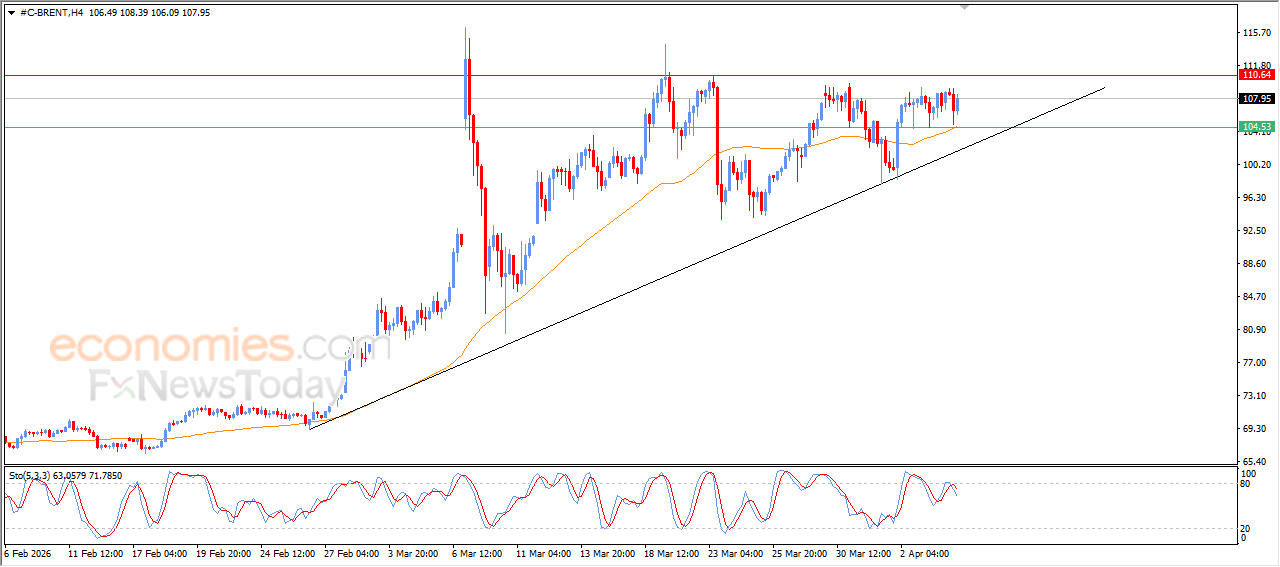
Brent crude oil prices rose during recent intraday trading, supported by a rebound from EMA50, which provided positive momentum and helped the price recover most of its earlier losses from the start of the day.
This comes amid the continued dominance of a short-term bullish trend, with price movements alongside an upward trendline supporting this path. However, negative signals have begun to emerge from the relative strength indicators, which may limit further gains in the near term.
Forecast update for Bitcoin -07-04-2026
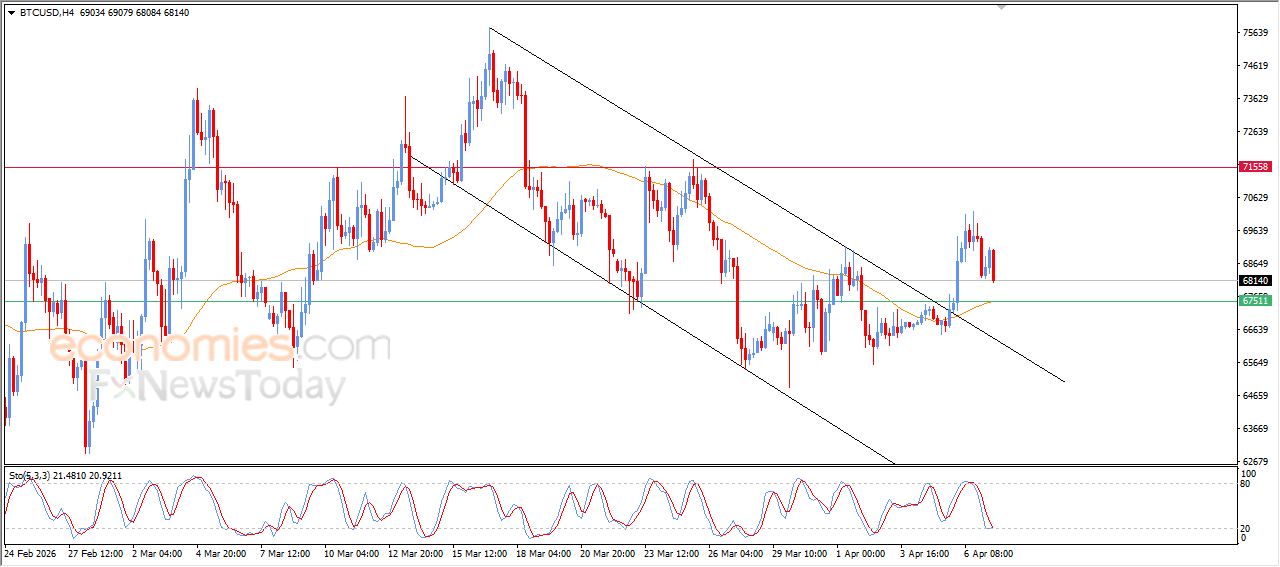
Bitcoin (BTCUSD) deepened its losses during its latest intraday trading, as the price attempts to find a higher low to use as a base that may help it gain positive momentum, allowing it to recover and rise again. This comes amid continued dynamic support from trading above its EMA50.
The price was also influenced by breaking out of a short-term downward corrective price channel. In the background, we notice the beginning of a positive crossover in the relative strength indicators, after reaching heavily oversold levels, excessively compared to price movement, suggesting the formation of a positive divergence that supports the recovery scenario.