Uber price returns higher - Forecast today - 17-07-2024

Uber Technologies’ stock (UBER) returned higher in the intraday levels, managing to pierce the current resistance of $72.64, amid the dominance of the main upward trend, as the stock trades alongside the secondary short-term trend line, while trading above the 50-day SMA, coupled with positive signals from the RSI despite reaching overbought levels.
Therefore we expect more gains for the stock, targeting the pivotal resistance of $82.00, provided it settles above $72.64.
Trend forecast: Bullish
Microsoft and the Obsession with Trading in AI-Invested Companies

Technical Analysis of Microsoft Stock
Microsoft's stock has been on a long-term upward trajectory. Since early 2019, the stock has been rising from the $94.00 area to the current record levels, carried by a long-term upward trend line as shown in the following weekly chart:
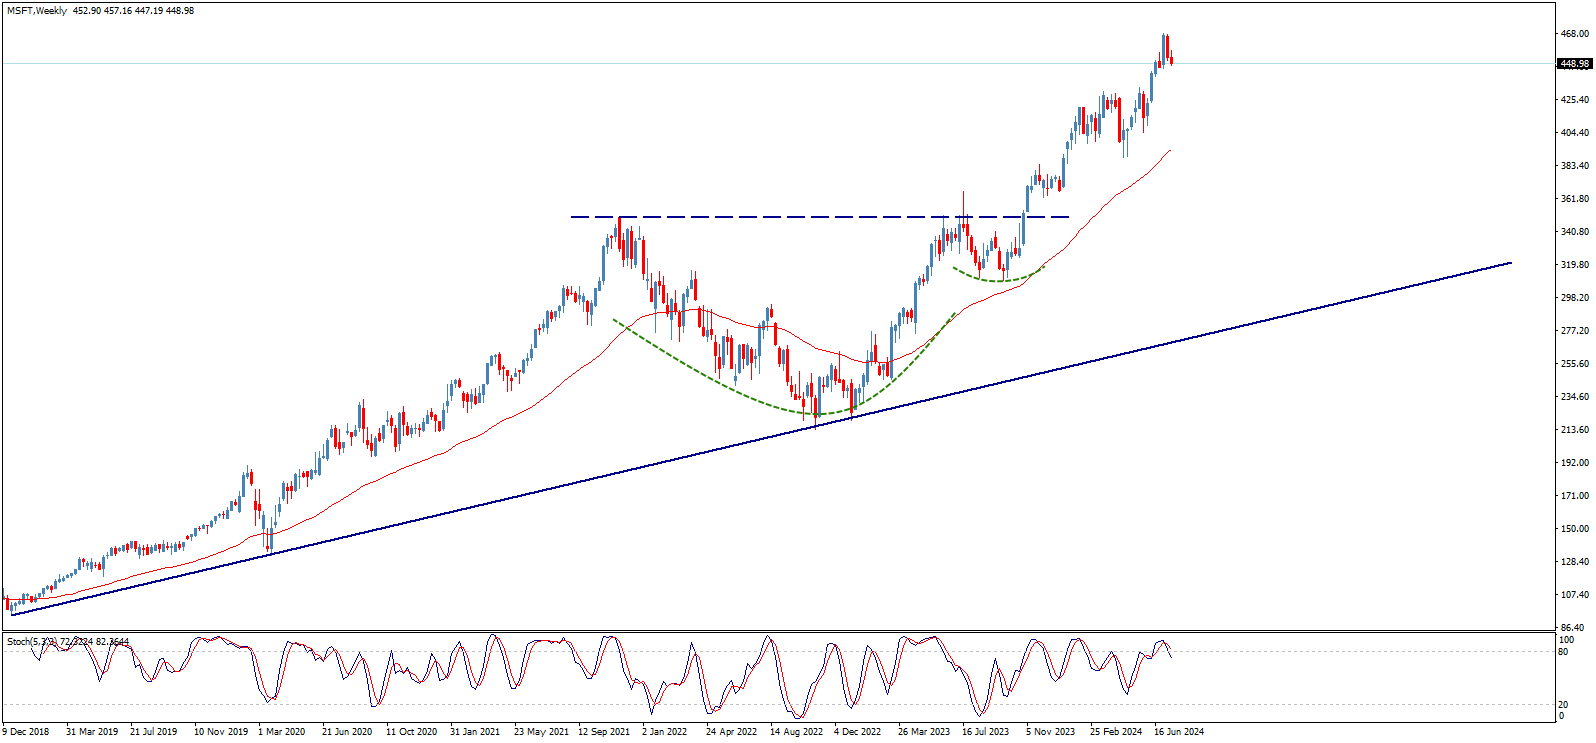
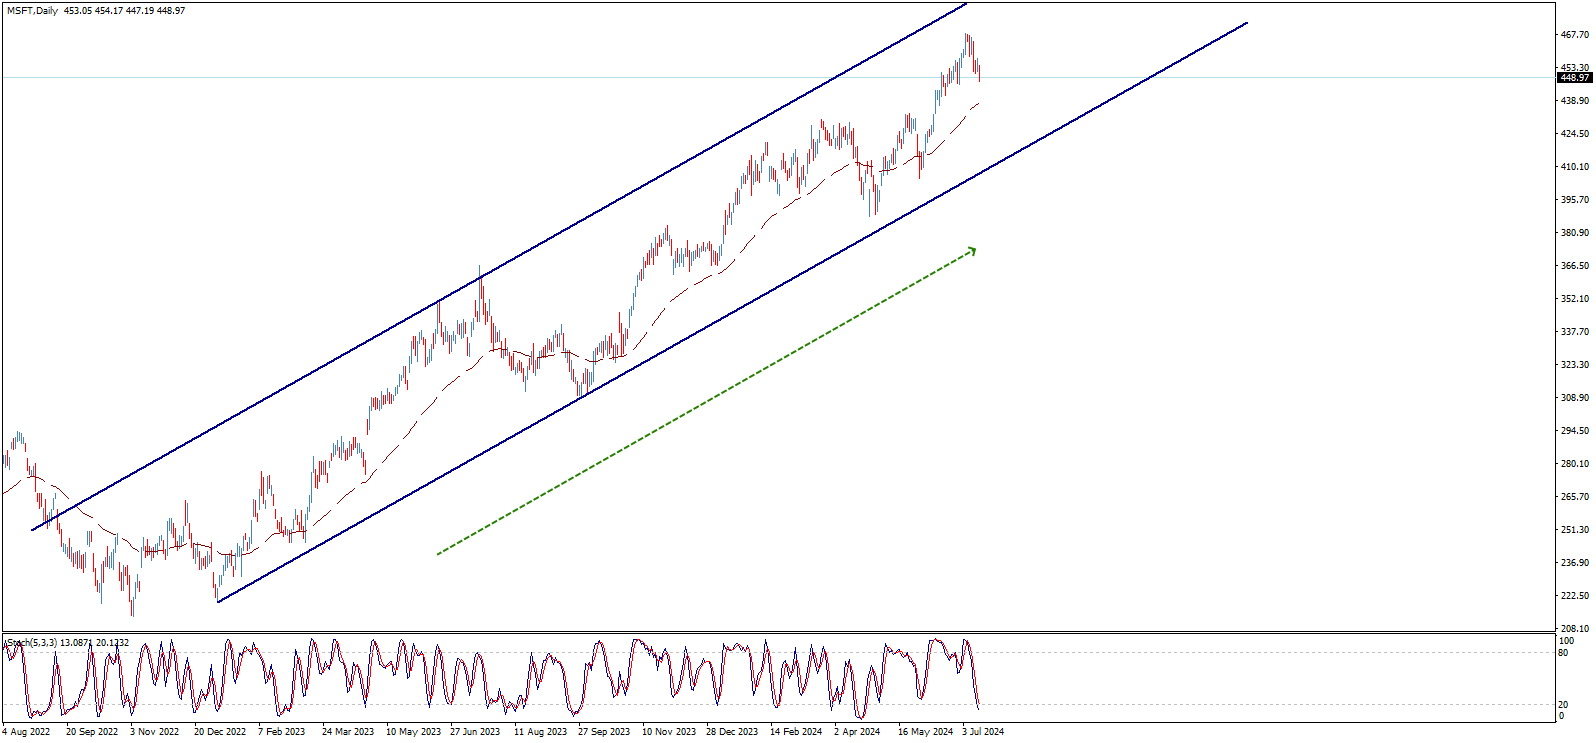
The Mentioned Upward Wave
It is organized within an ascending channel that carries the price to achieve additional expected gains in the upcoming period, with the next target reaching the $490.00 - $500.00 areas, possibly preceded by some temporary downward correction, especially since momentum indicators show overbought conditions on long-term time frames.
On the other hand, the 50 EMA provides positive support to the price continuously, enhancing the chances of continuing the rise and achieving further gains. However, it is essential to note that breaking $446.00 then $437.00 will confirm a short-term negative corrective pressure.
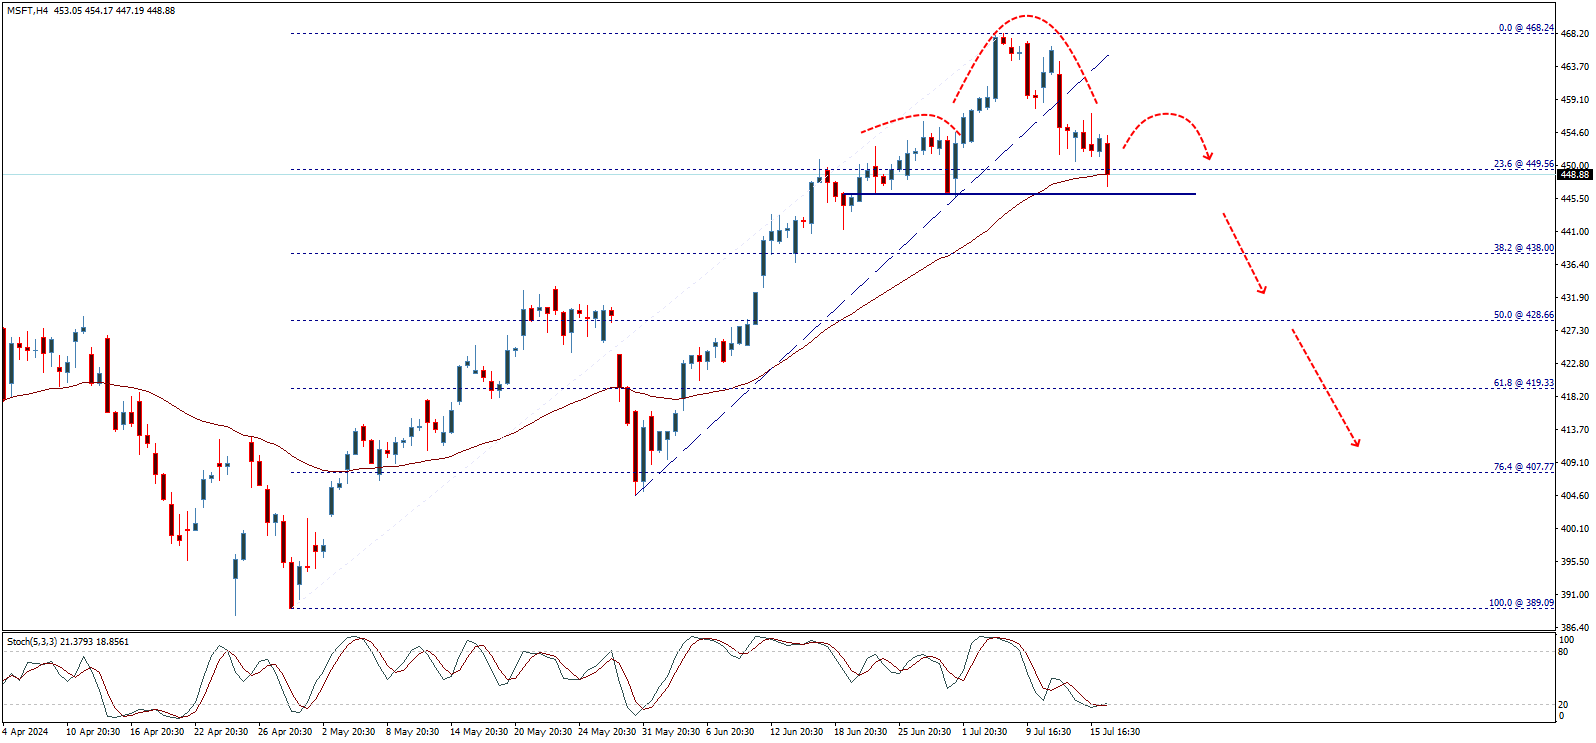
Possible Downward Correction and Negative Pattern
It is necessary to note that breaking the $446.00 then $437.00 levels will put the price under negative pressure, with targets reaching $419.35 and possibly extending to $407.80 before resuming the rise again, especially since there is a possible negative technical formation currently taking shape, as shown in the following chart:
Summary of the Above
The long-term upward trend is still in place, and the price is expected to register new record levels reaching the $500.00 areas, possibly preceded by some temporary downward correction. However, it is crucial to note that if the negative pressure continues and the price clearly breaks the $410.00 - $408.00 levels, it is expected to face long-term downward corrective pressure, heading towards additional losses with the next targets at $373.15 and possibly extending to $343.75 before resuming the rise again.
Best AI Stocks Trading Companies
- Pepperstone, the best company for trading Microsoft stocks and AI-investing companies. Trusted for beginners. Dubai license. Minimum deposit: $0. 20% discount on trading.
- Plus500, the best licensed brokerage for trading Microsoft stocks and AI-investing companies. Dubai license. Minimum deposit: $100.
- XM, the best platform for trading Microsoft stocks and AI-investing companies. Offers educational materials and trade copying. Dubai license. Minimum deposit: $5. Periodic financial contests and prizes.

Microsoft Stock Nears $500 USD for the First Time in History
In a move reflecting the growing confidence in the company's future performance and innovations in various fields of technology and artificial intelligence, Microsoft stock hit a new record level in early July, surpassing the $400 barrier for the first time in history.
Microsoft Innovations
Microsoft launched a range of new products and services in the first half of 2024, which contributed to increasing its revenues and boosting demand for its shares. Among these products were major updates to the Windows operating system, advanced cloud solutions via the Azure platform, and cutting-edge AI technologies.
- Major updates to the Windows operating system
- Advanced cloud solutions via the Azure platform
- Cutting-edge AI technologies
Strong Financial Results
Microsoft announced strong financial results for the second quarter of 2024, with significant increases in revenues and profits. The results exceeded analysts' expectations, further boosting investors' confidence in the company's ability to achieve sustainable growth in the future.
| Indicator | Value | Expectations |
|---|---|---|
| Earnings Per Share | $2.94 | $2.82 |
| Revenues | $61.86 billion | $60.80 billion |
Investments in AI
Microsoft is one of the leading companies in the field of artificial intelligence (AI) technology, having invested significantly in developing and applying this technology in various products and services.
- Massive investments in research and development
- Azure platform and artificial intelligence
- Personal assistant Cortana
- Improving user experience in Microsoft products
- AI in healthcare
- Collaboration with academic institutions and companies
- AI ethics
- The future of AI in Microsoft
Key Price Levels of Microsoft Stock
| Date | Price |
|---|---|
| March 1986 | $0.055 (Lowest Level) |
| July 2024 | $468.35 (Highest Level) |
Best Performance of Microsoft Stock in History
- 1987: Best annual performance ever, with a 125% increase
- Q1 1987: Best quarterly performance ever, with a 100% increase
- January 1987: Best monthly performance ever, with a 52% increase
Worst Performance of Microsoft Stock in History
- 2000: Worst annual performance ever, with a 63% decrease
- Q3 2001: Worst quarterly performance ever, with a 30% decrease
- April 2000: Worst monthly performance ever, with a 34% decrease
Key Events in Microsoft History
| Date | Event |
|---|---|
| March 1986 | Microsoft stock began trading on Wall Street at $0.0601 |
| November 1986 | Microsoft stock traded above $0.100 for the first time |
| May 1987 | Microsoft stock surpassed the $0.25 barrier for the first time |
| March 1990 | Microsoft stock traded above $0.500 for the first time |
| April 1991 | Microsoft stock surpassed the $1.0 barrier for the first time |
| September 1996 | Microsoft stock traded above $5.0 for the first time |
| June 1997 | Microsoft stock surpassed the $10 barrier for the first time |
| January 1999 | Microsoft stock traded above $25 for the first time |
| December 2015 | Microsoft stock surpassed the $50 barrier for the first time |
| July 2018 | Microsoft stock traded above $100 for the first time |
| July 2020 | Microsoft stock surpassed the $200 barrier for the first time |
| October 2021 | Microsoft stock traded above $300 for the first time |
| January 2024 | Microsoft stock surpassed the $400 barrier for the first time |
Top Predictions for Microsoft Stock in 2024
- Goldman Sachs: The group expects Microsoft stock to reach $515 by the end of 2024
- Wells Fargo: The company expects Microsoft stock to reach $500 by the end of 2024
- UBS: The German bank expects Microsoft stock to reach $480 by the end of 2024
- JP Morgan: The group expects Microsoft stock to reach $470 by the end of 2024
- Sanford C. Bernstein: The company expects Microsoft stock to reach $489 by the end of 2024
- Wedbush: The company expects Microsoft stock to reach $500 by the end of this year
Factors Affecting Microsoft Stock Predictions
- The company's financial performance
- Growth in the cloud computing sector
- Developments in the field of artificial intelligence
- Innovation and expansion into new areas
- Government and regulatory policies
- Market competition
- Global economic developments
- Technology trends
- Executive management and company strategies
- Sustainability and corporate social responsibility initiatives
Frequently Asked Questions About Microsoft
Is Microsoft stock a good investment? Microsoft stock is currently trading around $450. In light of most predictions pointing to a bullish market for the second-largest company by market value in the world, we believe that levels of $425 - $400 are suitable for investment, with a target above $500 in 2024 and near $1,000 in 2025.
How to invest in Microsoft? You cannot invest directly in Microsoft as it is a public company and not a tradable instrument. However, there are two main ways to indirectly invest in Microsoft:
- Buying Microsoft stock (NASDAQ: MSFT):
- You can buy Microsoft stock through a broker or online trading platform.
- When you buy Microsoft stock, you own a small share of the company and benefit from its profits and future growth.
- Microsoft stock is a risky investment and its value can fluctuate significantly.
- Exchange-Traded Funds (ETFs) that include Microsoft:
- ETFs track the performance of an index or a basket of stocks.
- There are many ETFs that include Microsoft, such as QQQ and VGT.
- ETFs provide an easy and diversified way to invest in Microsoft.
- ETFs are less risky than individual company stocks as they are spread across a group of stocks.
Will Microsoft stock reach $500 in 2024? In light of recent developments regarding the future of US interest rates, and the current pricing around two cuts in September and November, the technology sector will be the biggest beneficiary of market liquidity and lower borrowing costs. Therefore, it is not entirely out of the question for Microsoft stock to reach $500 in 2024, with this level being strongly surpassed in the following years.
Is Microsoft stock expected to rise in 2024? Yes, Microsoft stock is expected to continue rising this year, with most forecasts from major institutions, banks, and experts indicating a bullish market for Microsoft stock.
Largest Companies by Market Cap in 2024
| Rank | Company | Market Cap (Trillion USD) |
|---|---|---|
| 1 | Apple | 3.6 |
| 2 | Microsoft | 3.34 |
| 3 | NVIDIA | 3.11 |
| 4 | Alphabet (Google) | 2.281 |
| 5 | Amazon | 2.008 |
| 6 | Saudi Aramco | 1.824 |
| 7 | Meta (Facebook) | 1.242 |
| 8 | Taiwan Semiconductor Manufacturing Company | 965 billion |
| 9 | Berkshire Hathaway | 947 billion |
| 10 | Eli Lilly | 941 billion |
List of Companies Investing in AI
- Microsoft - Stock symbol: MSFT
- Alphabet - Stock symbol: GOOGL
- Amazon - Stock symbol: AMZN
- NVIDIA - Stock symbol: NVDA
- IBM - Stock symbol: IBM
- Tesla - Stock symbol: TSLA
- Adobe - Stock symbol: ADBE
- Apple - Stock symbol: AAPL
- Facebook - Stock symbol: META
- Intel - Stock symbol: INTC
- Salesforce - Stock symbol: CRM
- Baidu - Stock symbol: BIDU
- Oracle - Stock symbol: ORCL
- Snap Inc - Stock symbol: SNAP
Brent oil price forecast update 17-07-2024

Brent oil price fluctuates around 84.10$ level since morning, and stochastic begins to lose the positive momentum gradually, waiting to motivate the price to resume the expected bearish trend for today, which its next target located at 82.74$, noting that breaking this level will push the price towards the next correctional level at 81.40$.
The expected trading range for today is between 82.20$ support and 85.20$ resistance.
Trend forecast: Bearish
Crude oil price forecast update 17-07-2024

Crude oil price is retesting the broken neckline of the double top pattern that appears on the chart and keeps its stability below it until now, to keep the negative effect of this pattern active until now, waiting to resume the correctional bearish wave that targets 80.08$ followed by 78.66$ levels as next main stations.
The EMA50 continues to support the suggested bearish wave, which will remain valid unless the price rallied to breach 81.84$ and hold above it.
The expected trading range for today is between 79.00$ support and 82.00$ resistance
Trend forecast: Bearish