Texas Instruments price driven lower by pivotal resistance - Forecast today - 19-08-2025
AI Summary
- Texas Instruments shares declined due to resistance at $195.00
- Stock remains in short-term corrective downtrend with negative pressure from trading below 50-day SMA
- Predicted to fall further as long as $195.00 resistance holds, targeting support at $177.95
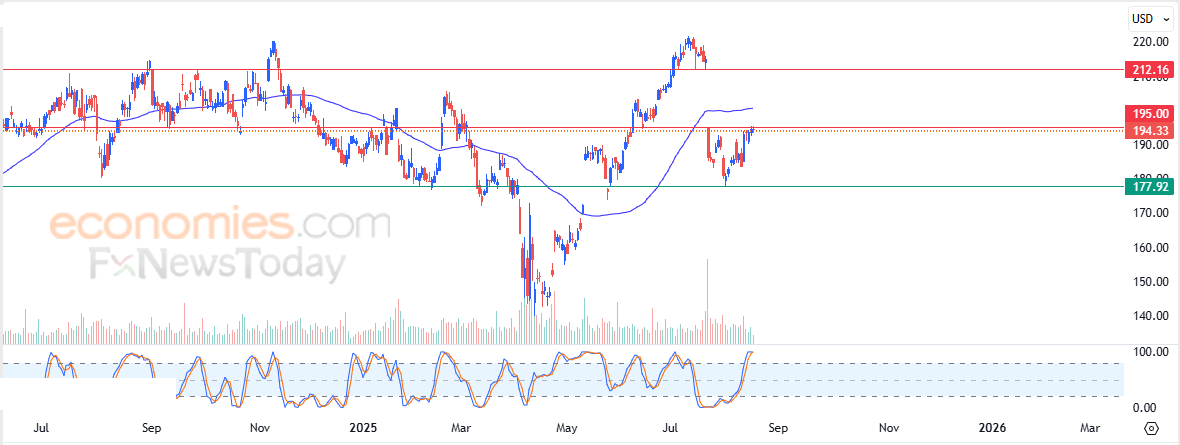
Texas Instruments Incorporated (TXN) shares declined slightly in their latest intraday trading, after the resistance level of $195.00 held firm. The stock remains under the control of a short-term corrective downtrend, with ongoing negative pressure from trading below the 50-day SMA. In addition, a bearish crossover has started to appear in the RSI indicators, after reaching extremely overbought levels compared to the stock’s movement, suggesting the formation of a negative divergence.
Therefore, we expect the stock to fall in its upcoming trading, as long as the $195.00 resistance holds, targeting the support level of $177.95.
Today’s stock forecast: Bearish
Pinterest price tries to shake off negative pressure - Forecast today - 19-08-2025
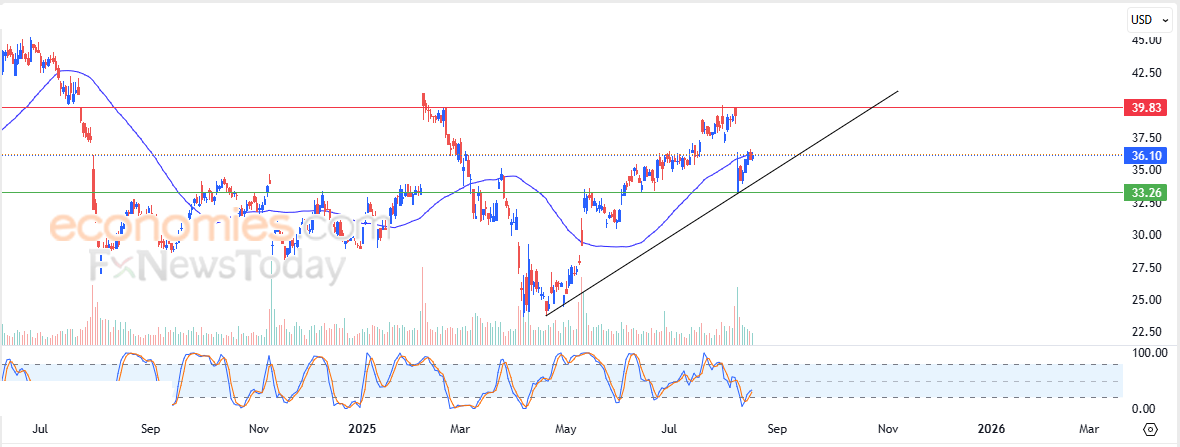
Pinterest (PINS) stock inched slightly higher in its latest intraday trading, attempting to overcome the negative pressure from the 50-day SMA. The stock is moving within the short-term corrective bullish trend, trading along a supporting upward slope line. In addition, positive signals have started to appear on RSI indicators after reaching extremely oversold areas.
Therefore, we expect the stock to rise in its upcoming trading, as long as support holds at $33.25, targeting the pivotal resistance level of $39.80.
Today’s stock forecast: Bullish
Under Armour price stays flat - Forecast today - 19-08-2025
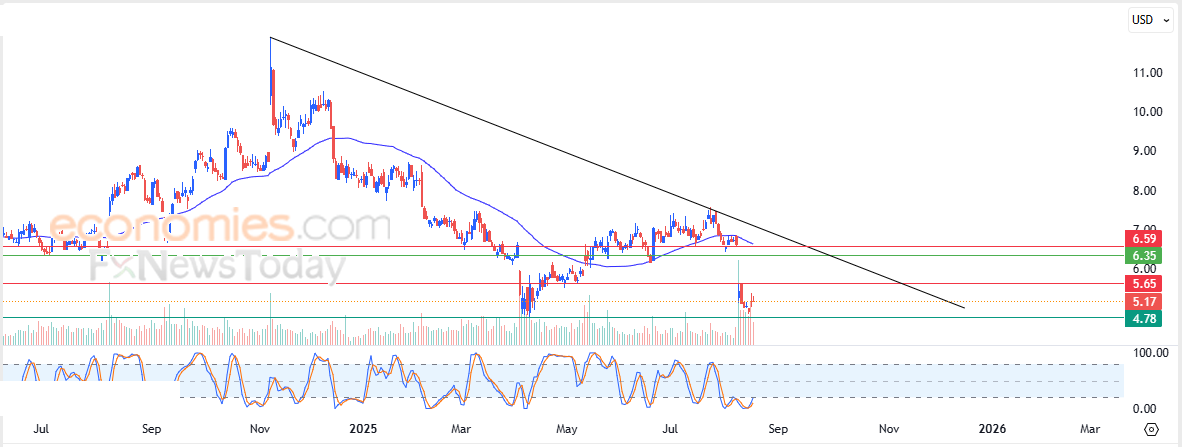
Under Armour (UAA) stock closed its latest session unchanged, as the stock attempts to ease its clear oversold conditions on the RSI indicators, especially with the emergence of positive signals. However, downside pressure persists from trading below the 50-day SMA and under the dominance of the main short-term bearish trend, with price action moving along a descending slope line.
Therefore, we expect the stock to decline in its upcoming trading, as long as it remains below $5.65, targeting the pivotal support level of $4.75.
Today’s stock forecast: Bearish
Forecast update for Ethereum -19-08-2025
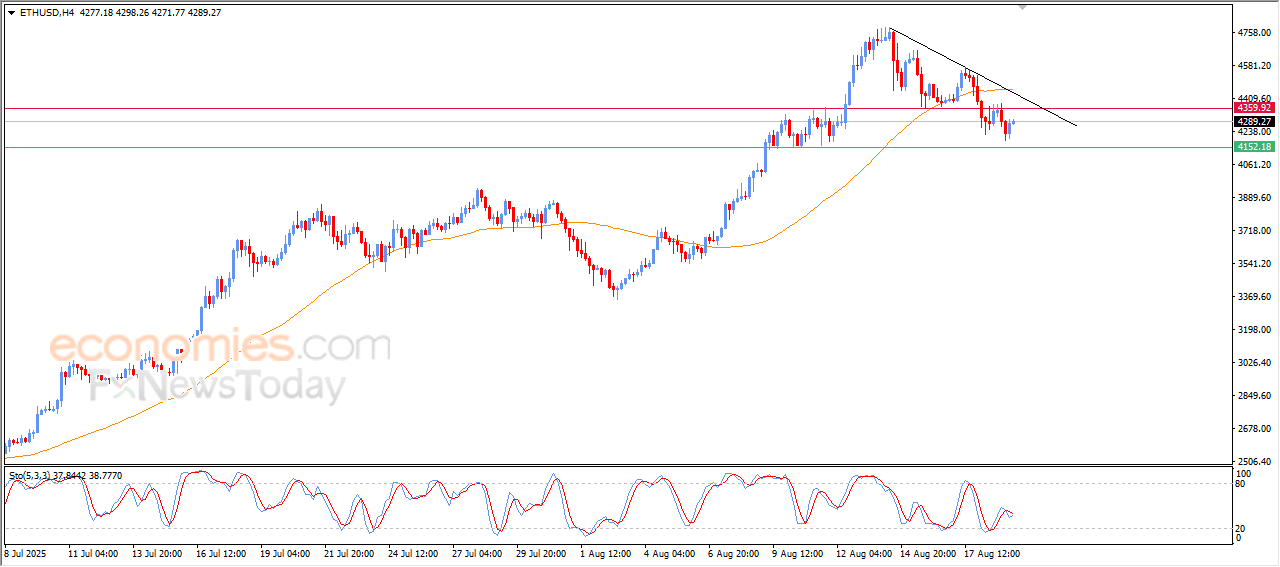
The price of (ETHUSD) rose in its last intraday trading, offloading its clear oversold conditions on the (RSI), amid the dominance of bearish correctional wave on the short-term basis on the (RSI), amid the dominance of bearish correctional wave on the short-term basis, alongside a supportive bias line for this track, with the continuation of the negative pressure that comes from its trading below EMA50, besides the emergence of the negative signals on the (RSI), intensifying the negative pressure around the price.
VIP Trading Signals Performance by BestTradingSignal.com (August 11–15, 2025)
BestTradingSignal.com – Professional Trading Signals with high accuracy. Subscribe now to tailored packages for the world’s leading markets and receive signals instantly via Telegram from an expert team:
US Stock Signals from €44/month
Subscribe via TelegramCrypto Signals from €49/month
Subscribe via TelegramForex Signals from €49/month
Subscribe via TelegramVIP Signals (Gold, Oil, Forex, Bitcoin, Ethereum, Indices) from €179/month
Subscribe via TelegramCheck full VIP signals performance report for the week of August 11–15, 2025: Full Report