Oklo price under pressure from Head and Shoulders pattern - Forecast today - 17-11-2025
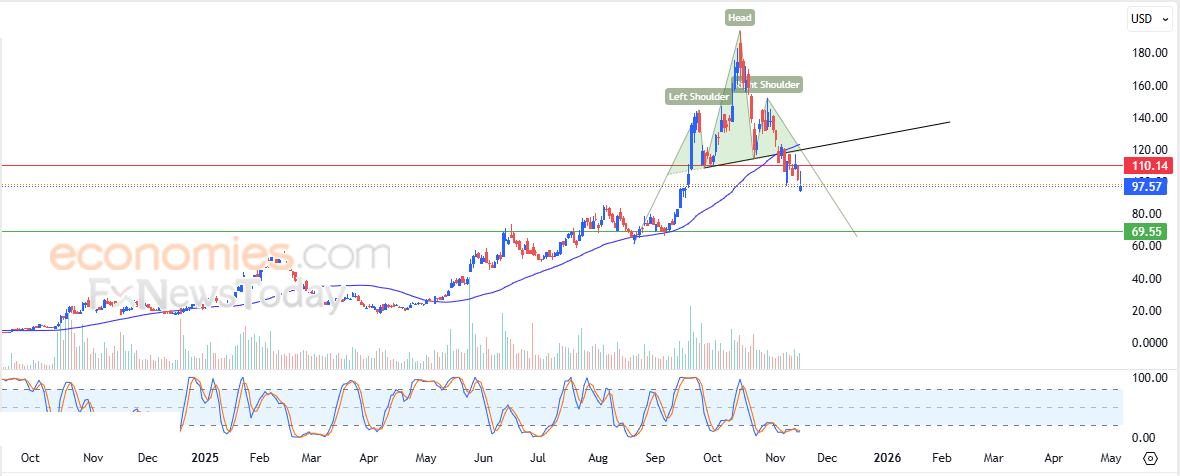
The price of Oklo (OKLO) declined in its latest intraday trading, pressured by a bearish technical structure forming on the short-term charts — a head and shoulders pattern. This comes alongside continued negative pressure from its trading below the 50-day simple moving average, which reduces the stock’s chances of a sustainable recovery in the near term. In the background, we also note the persistence of negative signals from the RSI indicators, despite their stabilization in heavily oversold areas.
Therefore, we expect the stock price to decline in the coming sessions, as long as it remains below the resistance level of $110.00, targeting the support level of $69.55 as the projected price objective of the head and shoulders pattern.
Today’s price forecast: Bearish
Forecast update for Ethereum -17-11-2025
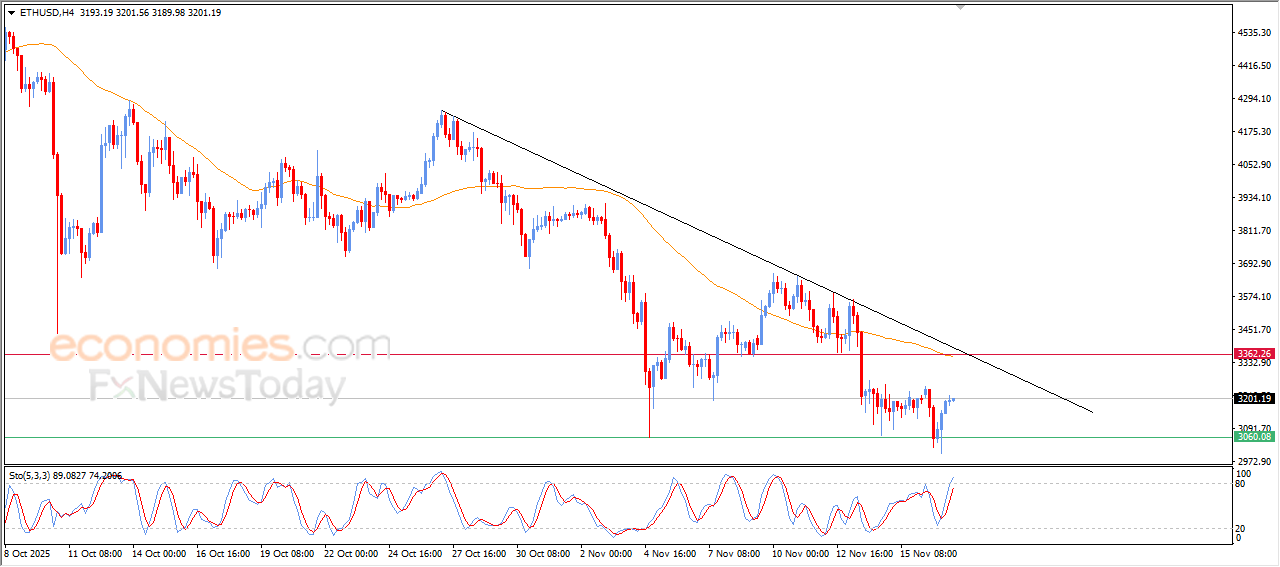
The price of (ETHUSD) extended its early gains in its last trading on the intraday basis, affected by the stability of the key support at $3,060, gaining bullish momentum by the emergence of the positive signals on the relative strength indicators, recovering some of its previous losses, amid the dominance of the main bearish trend on the short-term basis and its trading alongside trendline, with the relative strength indicators reaching exaggerated overbought levels compared to the price move, indicating a quick fading for the bullish momentum.
Forecast update for bitcoin -17-11-2025
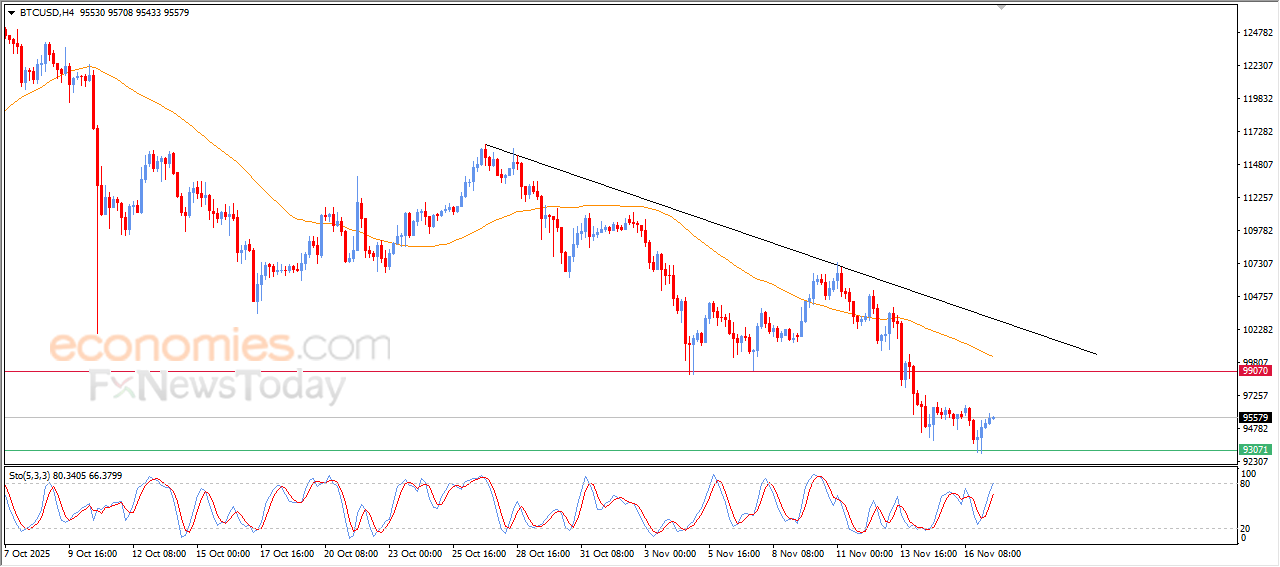
Bitcoin (BTCUSD) prices rose on their last intraday trading, supported by the emergence of the positive signals on the relative strength indicators, in attempt to recover some of its previous losses, amid the continuation of the negative and dynamic pressure that is represented by its trading below EMA50, reducing the chances of the price recovery on the near-term basis, amid the dominance of the main bearish trend and its trading alongside minor trendline on the short-term basis.
Forecast update for Brent crude oil -17-11-2025
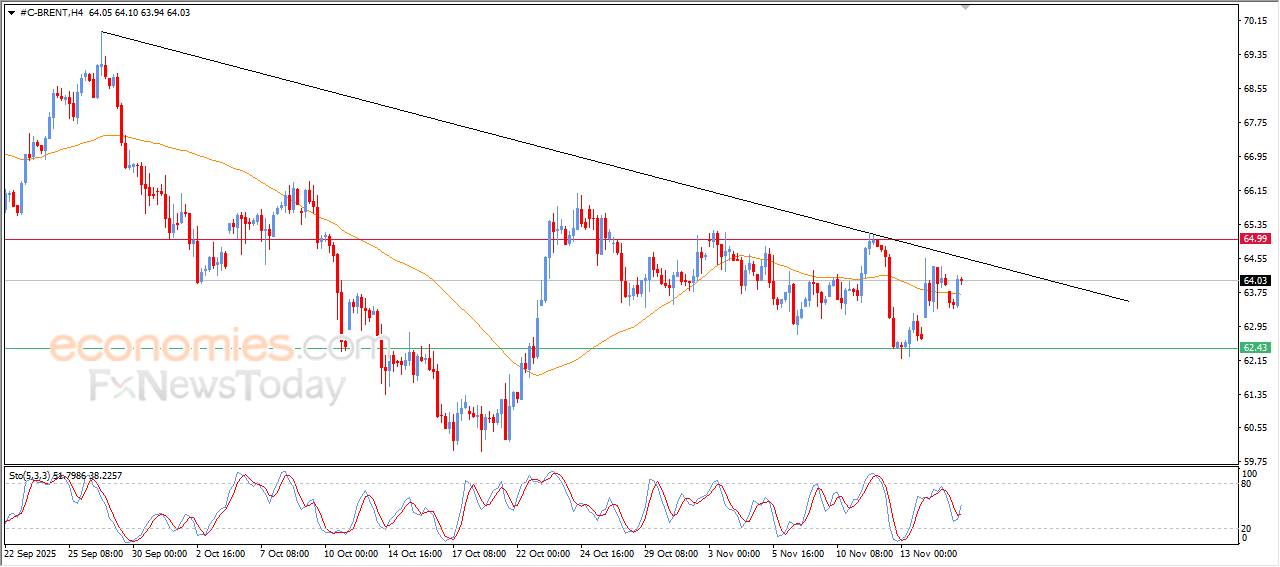
Brent crude oil prices rose in their last intraday trading, amid the trading alongside main bearish trend line on the short-term basis, on the other hand, the price managed to surpass the resistance of its EMA50, for the second time in a row over two trading sessions, to indicate surpassing its negative pressure, creating a confused area to help it detect its next trend.