


 |
Novavax readies to breach pivotal support - Analysis - 23-02-2023
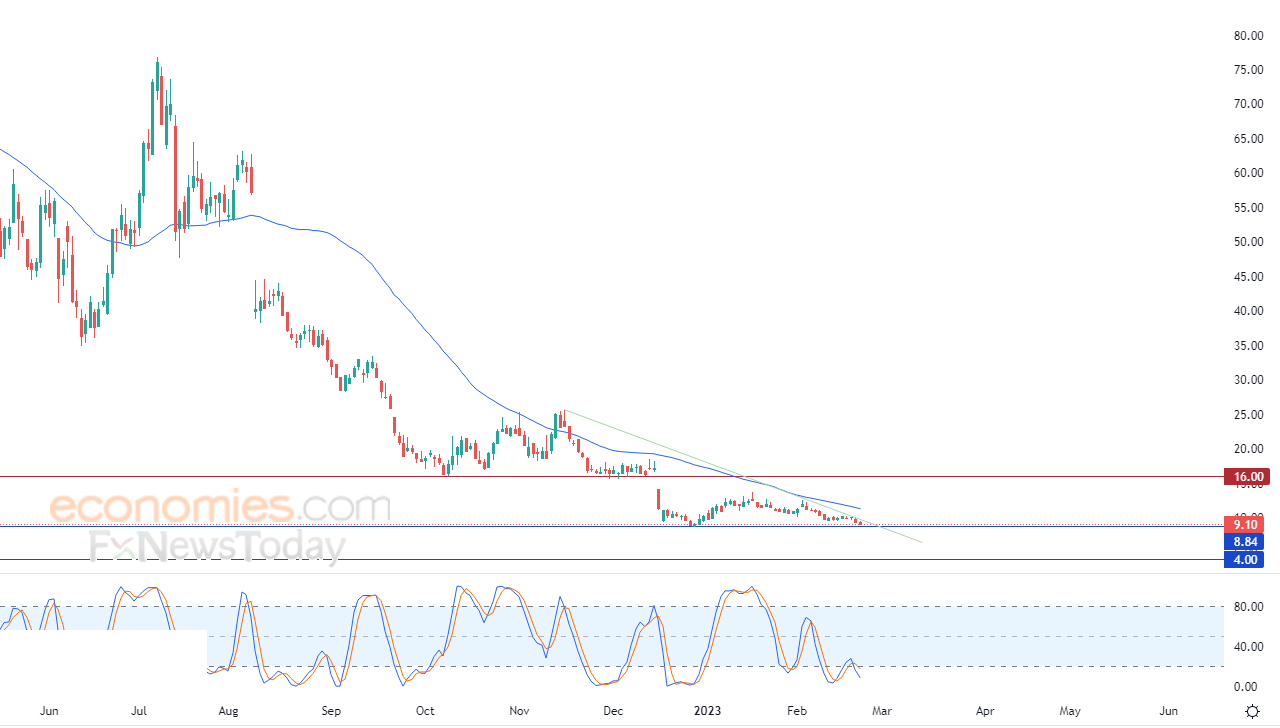
Novavax's strock (NVAX) fell in the intraday levels, marking a loss of 3.09% in the last session, or 29 cents, and settling at 9.10, amid negative pressure from the 50-day SMA, coupled with the dominance of the main downward trend in the medium and short terms, with negative signals from the RSI despite settling at oversold levels.
Therefore we expect more losses for the stock, targeting the support of 4.00, provided the pivotal support of 8.85 was breached.
Expected trend for today: Bearish
Thanks for your feedback.
Nvidia seeks a bottom to bolster it - Analysis - 23-02-2023

Nvidia's stock (NVDA) advanced in the last session after reporting forecast-beating profits at 88 cents per share on earnings of $6.05 billion, with Wall Street expecting 81 cents on earnings of $6.02 billion, sending the stock up 0.48% in the last session, or 99 cents, and settling at 207.54, with trading volumes surpassing 51 million shares, slightly below 10-day averages.
MoreXerox receives some support - Analysis - 23-02-2023

Xerox Holdings Corp's stock (XRX) rose in the intraday levels, after leaning on the 50-day SMA support, and lending it positive momentum, while buoyed by piercing the main downward trend line previously, marking a profit of 0.12% in the last session, or two cents, and settling at 16.25, with negative signals from the RSI, curbing recent gains.
MoreAmerican International climbs amid negative pressures - Analysis - 23-02-2023
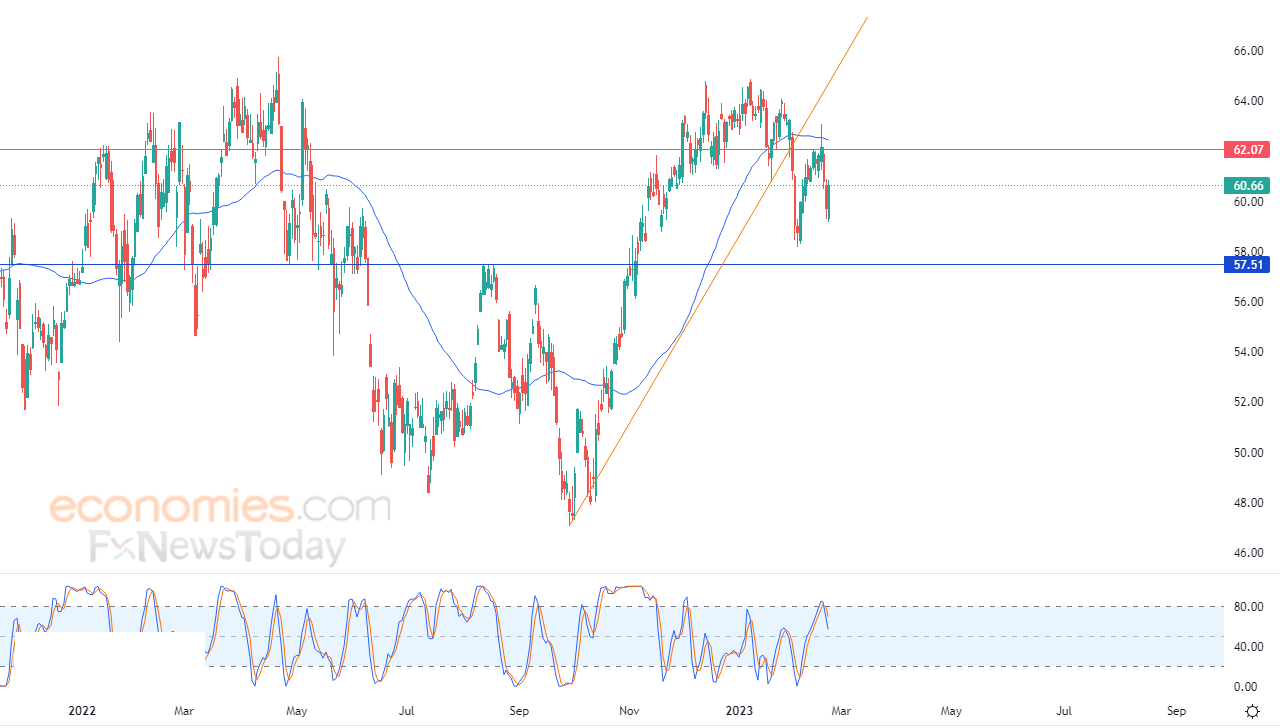
American International Group's stock (AIG) rose in the intraday levels, marking a fresh profit of 1.57% in the last session, or 94 cents, and settling at 60.66, while hurt by piercing the upward trend line recently, with negative pressure from the 50-day SMA, coupled with negative divergence in the RSI after reaching overbought levels compared to the stock's movements.
More