Lyft price gathers positive momentum - Forecast today - 27-10-2025
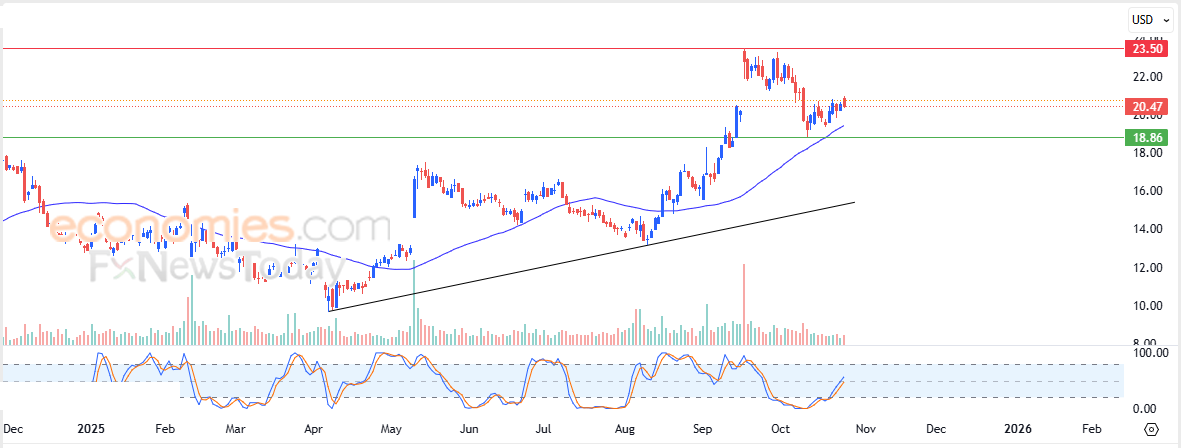
Lyft, Inc (LYFT) stock declined slightly in its latest intraday trading as it attempts to gain positive momentum that could help it rise again. The stock continues to benefit from dynamic support provided by trading above the previous 50-day SMA and remains under the dominance of the main short-term bullish trend. In addition, positive signals are appearing from the relative strength indicators, supporting the continuation of the upward movement.
Therefore, we expect the stock to rise in its upcoming trading sessions as long as the support level of $18.85 holds, targeting the key resistance level of $23.50.
Today’s stock forecast: Bullish.
Forecast update for crude oil -27-10-2025
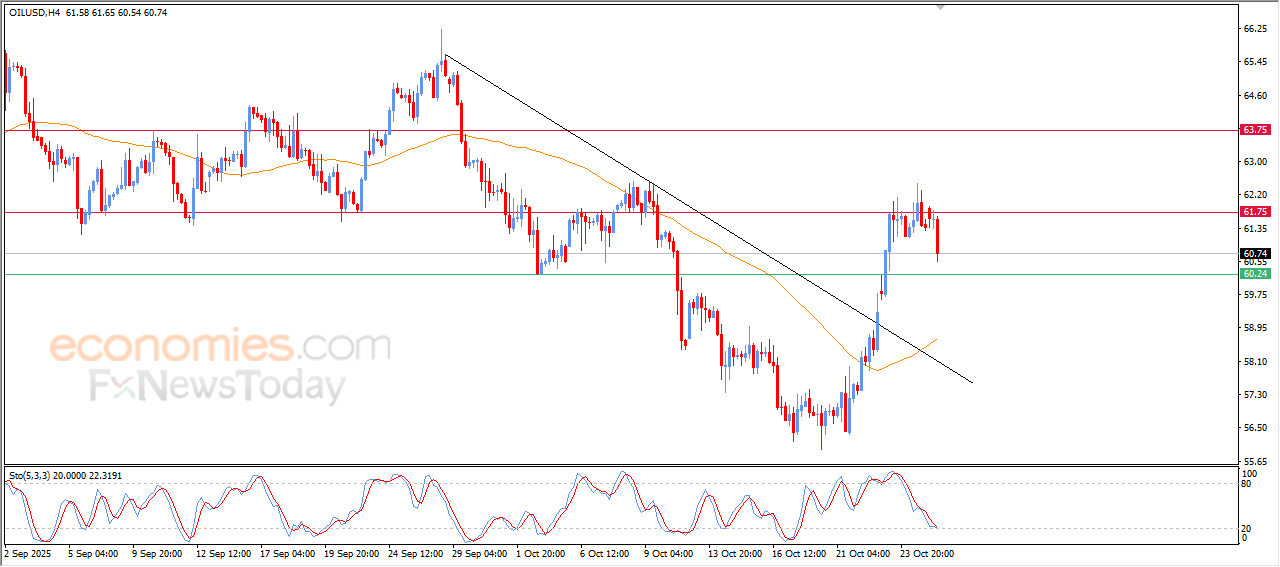
The price of (crude oil) declined in its last intraday trading, due to the stability of the stubborn resistance level at $61.75, attempting to gain bullish momentum that might help to breach this resistance, amid the dominance of bullish corrective wave on the short-term basis, supported by its continuous trading above its EMA50, reinforcing the chances of the price recovery in the upcoming period, especially with the relative strength indicators reaching oversold levels, exaggeratedly compared to the price move, indicating the beginning of forming bullish divergence.
VIP Trading Signals Performance by BestTradingSignal.com (13-17 Oct, 2025)
Get high-accuracy trading signals delivered directly to your Telegram. Subscribe to specialized packages tailored for the world’s top markets:
US Stock Signals from €44/month
Subscribe via TelegramCrypto Signals from €49/month
Subscribe via TelegramForex Signals from €49/month
Subscribe via TelegramVIP Signals (Gold, Oil, Forex, Bitcoin, Ethereum, Indices) from €179/month
Subscribe via TelegramFull VIP signals performance report for 13-17, October 2025:
View Full Performance Report Telegram (https://t.me/besttradingsignalstocksbot?start=p88d632b0-66dd-11f0-a948-13815052d5ae)
Forecast update for silver -27-10-2025
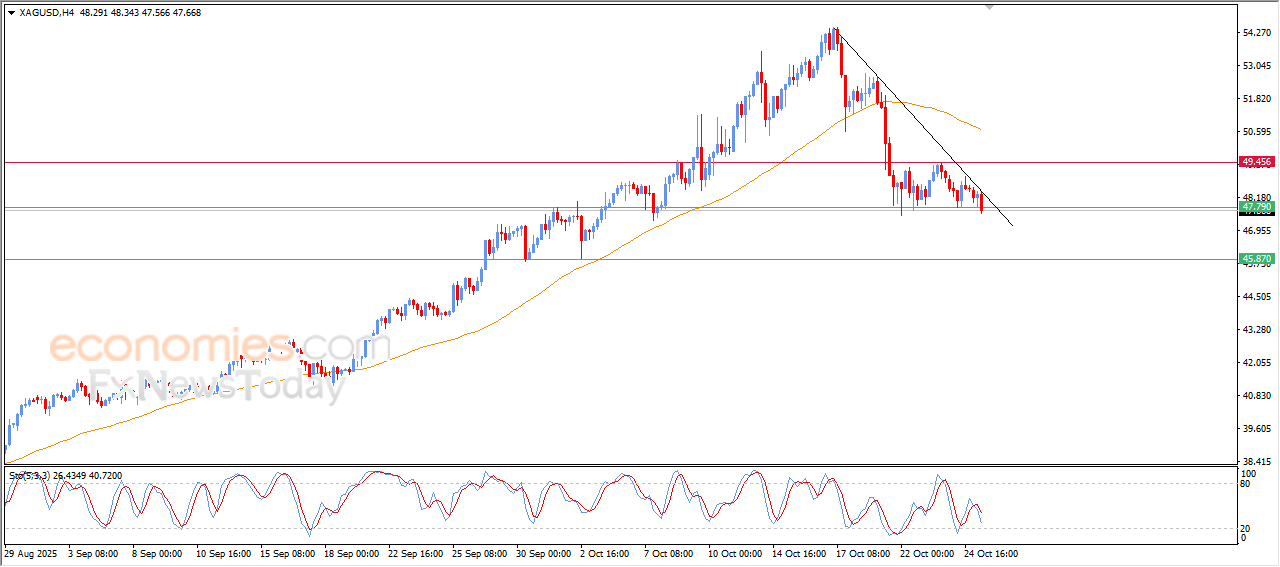
The price of (silver) declined during its last trading on the intraday basis, with the emergence of the negative signals on the relative strength indicators, after offloading its oversold conditions, opening the way for deepening its intraday losses, amid the continuation of the negative pressure that comes from its trading below EMA50, reinforcing the stability of the bearish corrective trend on the short-term basis.
VIP Trading Signals Performance by BestTradingSignal.com (13-17 Oct, 2025)
Get high-accuracy trading signals delivered directly to your Telegram. Subscribe to specialized packages tailored for the world’s top markets:
US Stock Signals from €44/month
Subscribe via TelegramCrypto Signals from €49/month
Subscribe via TelegramForex Signals from €49/month
Subscribe via TelegramVIP Signals (Gold, Oil, Forex, Bitcoin, Ethereum, Indices) from €179/month
Subscribe via TelegramFull VIP signals performance report for 13-17, October 2025:
View Full Performance Report Telegram (https://t.me/besttradingsignalstocksbot?start=p88d632b0-66dd-11f0-a948-13815052d5ae)
Forecast update for gold -27-10-2025.
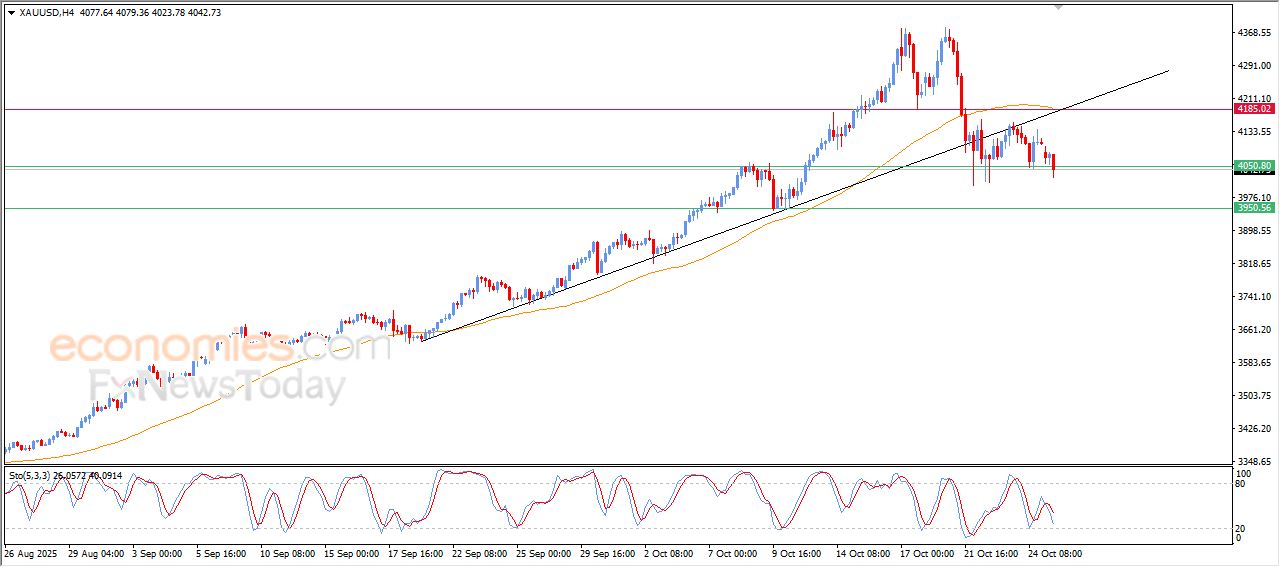
The price of (gold) declined in its last intraday trading, approaching form breaking the key support of $4,050, amid the dominance of bearish corrective wave on the short-term basis, affected by breaking main bullish trend line, with the continuation of the negative pressure due to its trading below EMA50, which reduces the chances of the recovery of the near-term basis, especially with the emergence of the negative signals on the relative strength indicators.
VIP Trading Signals Performance by BestTradingSignal.com (13-17 Oct, 2025)
Get high-accuracy trading signals delivered directly to your Telegram. Subscribe to specialized packages tailored for the world’s top markets:
US Stock Signals from €44/month
Subscribe via TelegramCrypto Signals from €49/month
Subscribe via TelegramForex Signals from €49/month
Subscribe via TelegramVIP Signals (Gold, Oil, Forex, Bitcoin, Ethereum, Indices) from €179/month
Subscribe via TelegramFull VIP signals performance report for 13-17, October 2025:
View Full Performance Report Telegram (https://t.me/besttradingsignalstocksbot?start=p88d632b0-66dd-11f0-a948-13815052d5ae)