IBM moves in negative zone - Analysis - 19-11-2019
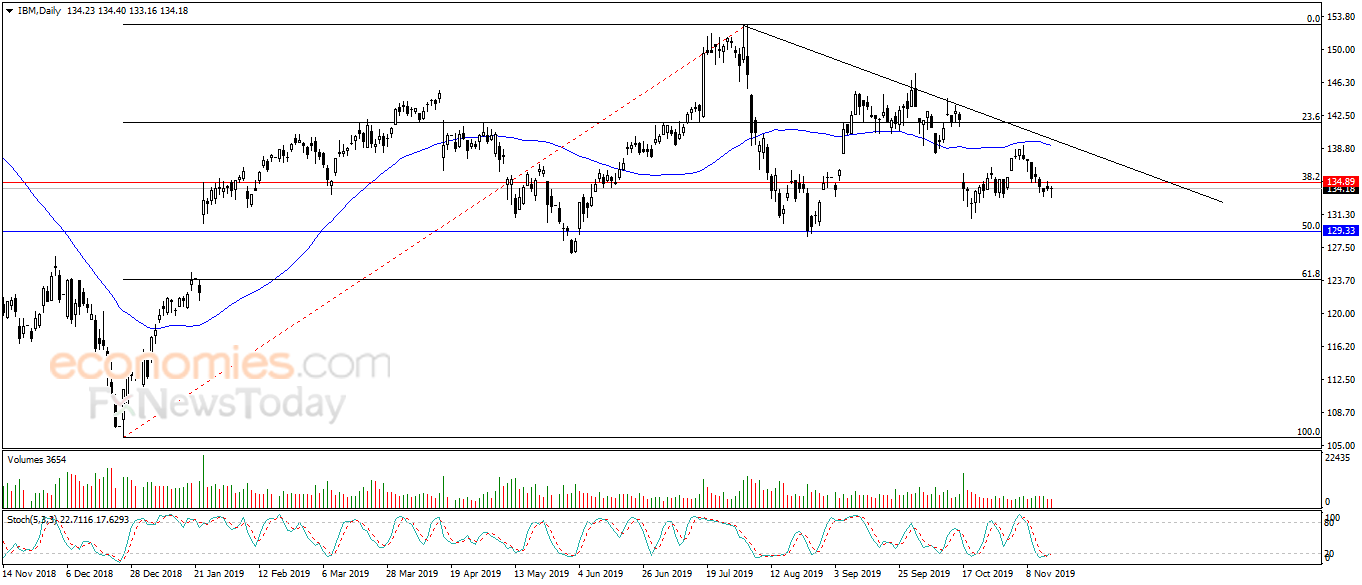
IBM's stock fell marginally with positive signals from the RSI, while settling below the resistance of 134.89, representing the ratio 50% of Fibonacci retracement levels for an ascending wave in the medium term (from 105.88 to 152.749), with negative pressure from the 50-day SMA.
Therefore we expect the stock to decline and target the next support at 129.33.
Expected trend for today: Bearish
AMD marks new record highs - Analysis - 19-11-2019

Adobe's stock kept rising in the short term, marking a fresh record high and a 3.42% profit, amid positive support from the 50-day SMA, with the dominance of the main upward trend in the long term, with positive signals from the RSI.
Therefore we expect more gains for the stock, targeting the resistance of 40.85.
Expected trend for today: Bullish
Adobe amid positive outlook - Analysis - 19-11-2019

Adobe's stock rose 0.09% in the last session amid the dominance of the main upward trend, with positive support from the 50-day SMA, while the RSI reached overbought levels.
Therefore we expect more gains for the stock, targeting the pivotal resistance of 313.00.
Expected trend for today: Bullish
Pfizer movies within ascending price channel - Analysis - 19-11-2019
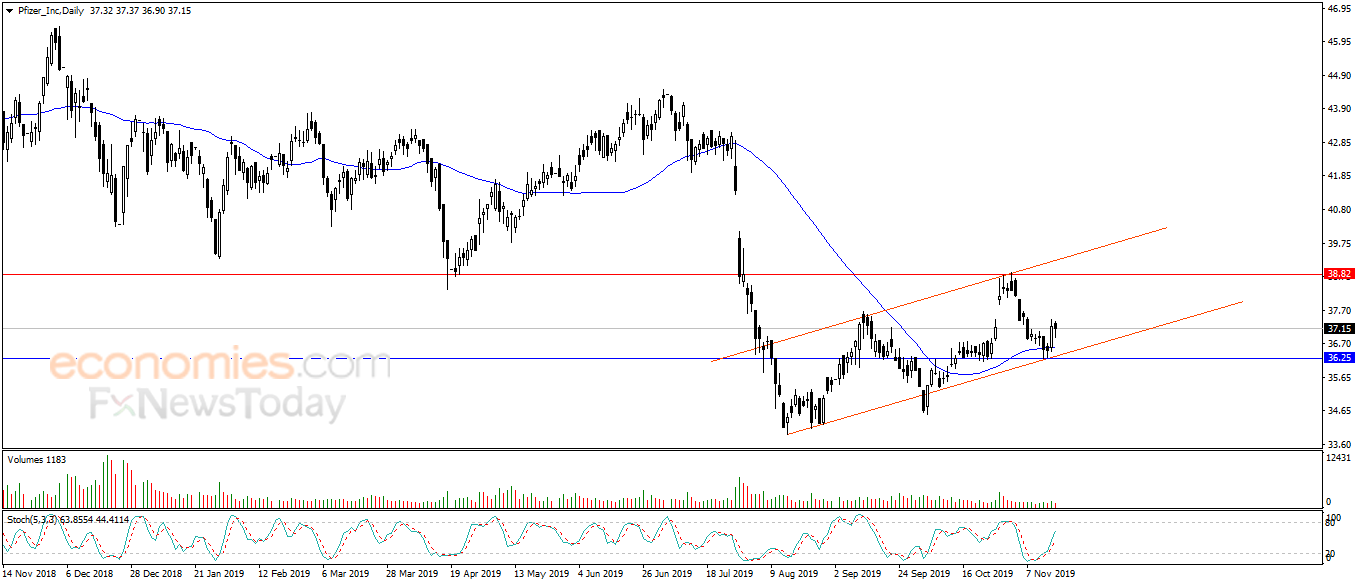
Pfizer's stock fell 0.16% in the last session while gathering momentum and trading within an ascending price channel in the short term, with positive signals from the RSI, with positive pressure from the 50-day SMA.
Therefore we expect the stock to rise and target the pivotal resistance of 38.80.
Expected trend for today: Bullish