


 |
|
Humana price tries to regain footing - Forecast today - 29-07-2026
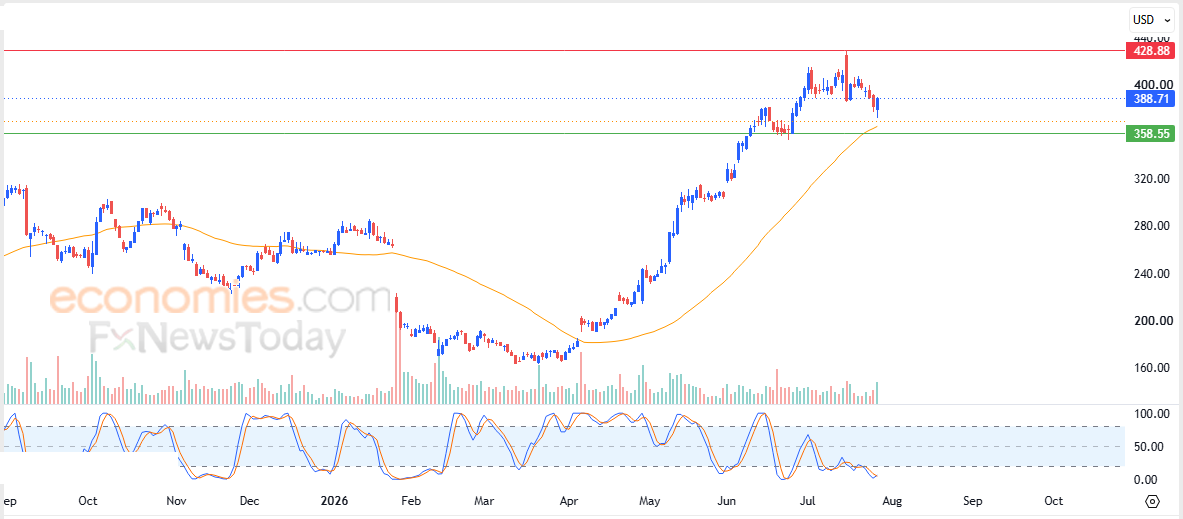
Humana Inc. (HUM) advanced in recent intraday trading after building positive momentum in previous sessions, reinforcing the strength of the primary short-term uptrend. The stock continues to benefit from the positive dynamic support provided by trading above its 50-day Simple Moving Average (SMA), which further improves the prospects for an extended recovery in the near term. Meanwhile, momentum indicators are beginning to form a bullish crossover after previously reaching extremely oversold territory, adding further support to the stock's positive technical outlook.
Therefore, our outlook remains bullish for the stock's upcoming trading sessions, as long as support at $358.55 remains intact. Under this scenario, the stock is expected to target the key resistance level at $428.85.
Today's price forecast: Bullish.
General Electric price keeps rising - Forecast today - 29-07-2026
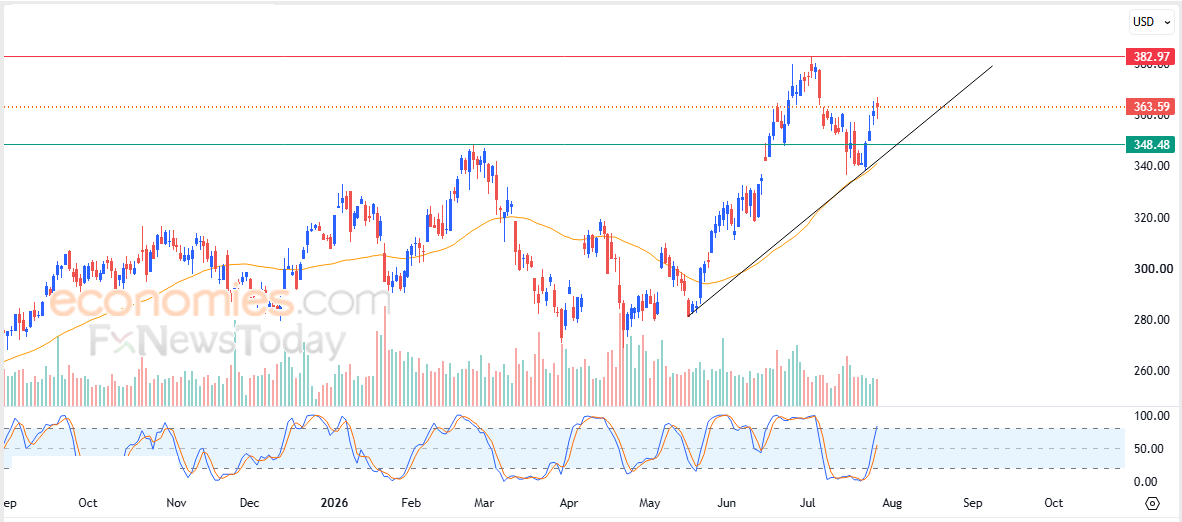
General Electric Company (GE) continued to advance in recent intraday trading, supported by the positive dynamic backing of its continued trading above the 50-day Simple Moving Average (SMA), which is reinforcing the strength and stability of the primary short-term uptrend. Price action also continues to move alongside an ascending trendline that supports the prevailing bullish trend. Meanwhile, momentum indicators continue to generate fresh bullish signals, further strengthening the stock's positive technical outlook.
MoreForecast update for Ethereum -29-07-2026
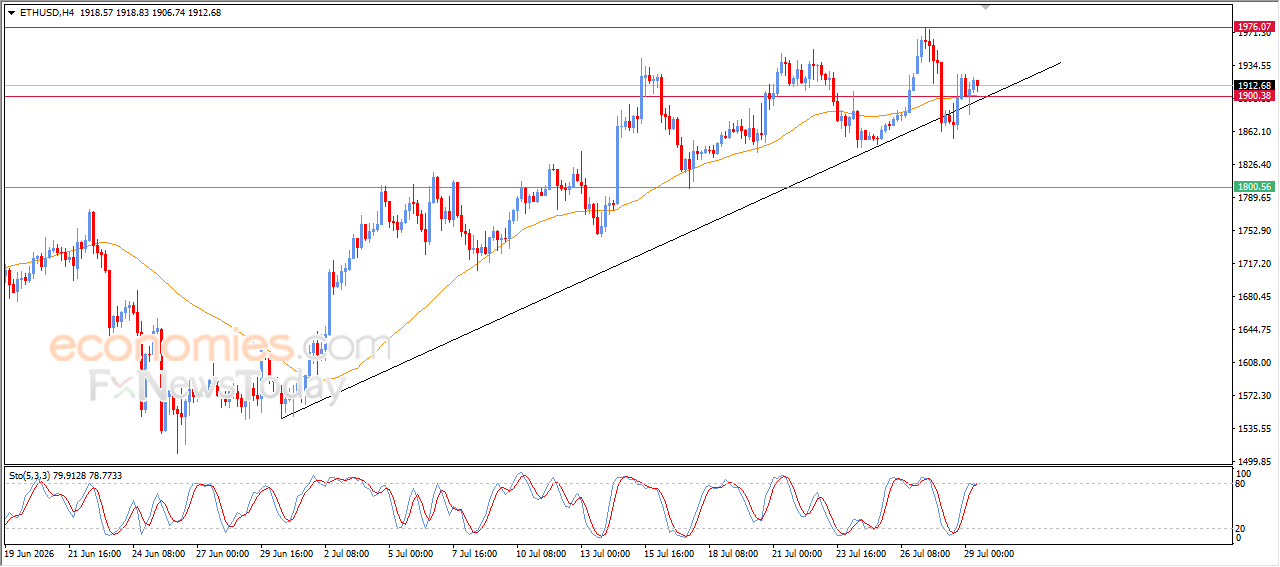
(ETHUSD) prices witnessed fluctuated trading in its last intraday trading, in attempt to gain a bullish momentum that might help it to resume its gains in the near upcoming period, amid the dominance of the main bullish trend on the short-term basis, with its trading alongside supportive trend line for this path, with the continuation of the trading above EMA50, providing a dynamic support base that reinforces the upside track, besides the emergence of positive signals from the relative strength indicators.
MoreForecast update for Bitcoin -29-07-2026
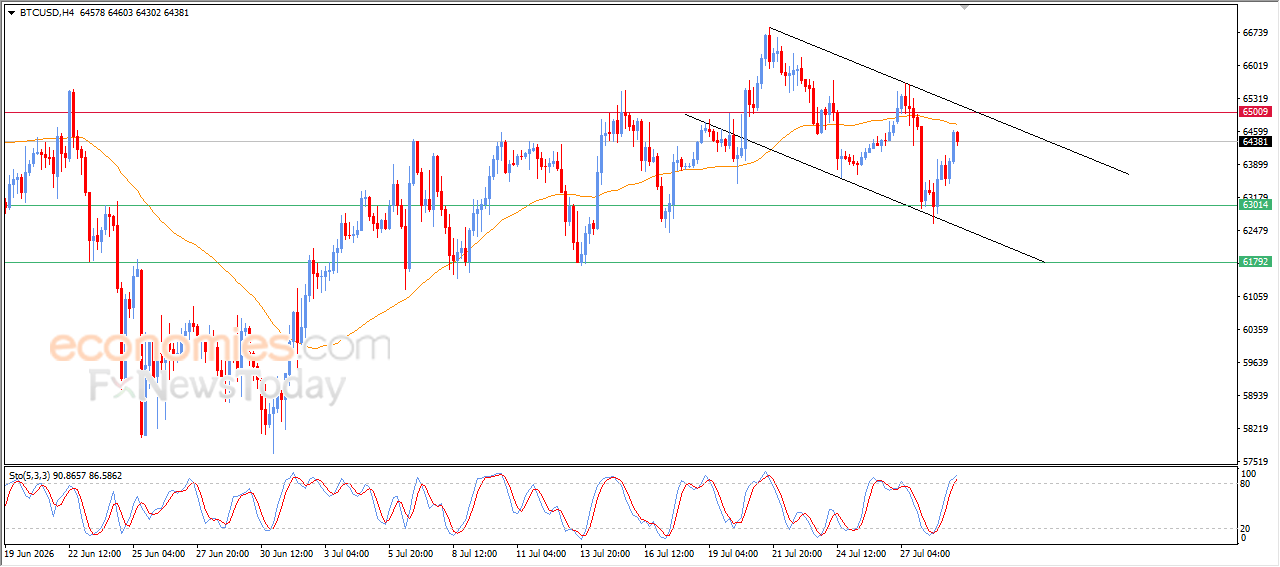
(BTCUSD) settles on sharp gains during its last intraday trading, moving within bearish corrective channel’s range that limited its previous trading on the short-term basis, with the continuation of the negative pressure that comes from its trading below EMA50, threatening these gains by a negative rebound, especially with the relative strength indicators reaching overbought levels, to indicate forming negative divergence.
More