Honeywell price driven lower by important resistance - Forecast today - 15-12-2025

Honeywell International Inc. (HON) declined in its latest intraday trading after colliding with the resistance of its previous 50-day SMA, with the firmness of the pivotal resistance level at $195.20 further intensifying the negative pressure surrounding the stock. In addition, the RSI indicators have reached extremely overbought levels in an exaggerated manner compared to the price movement, suggesting the early formation of a bearish divergence.
Therefore we expect the stock to decline in its upcoming trading, as long as it remains below the mentioned resistance level of $195.20, targeting the support level of $186.75.
Today’s price forecast: Bearish
United Airlines price gathers positive momentum - Forecast today - 15-12-2025
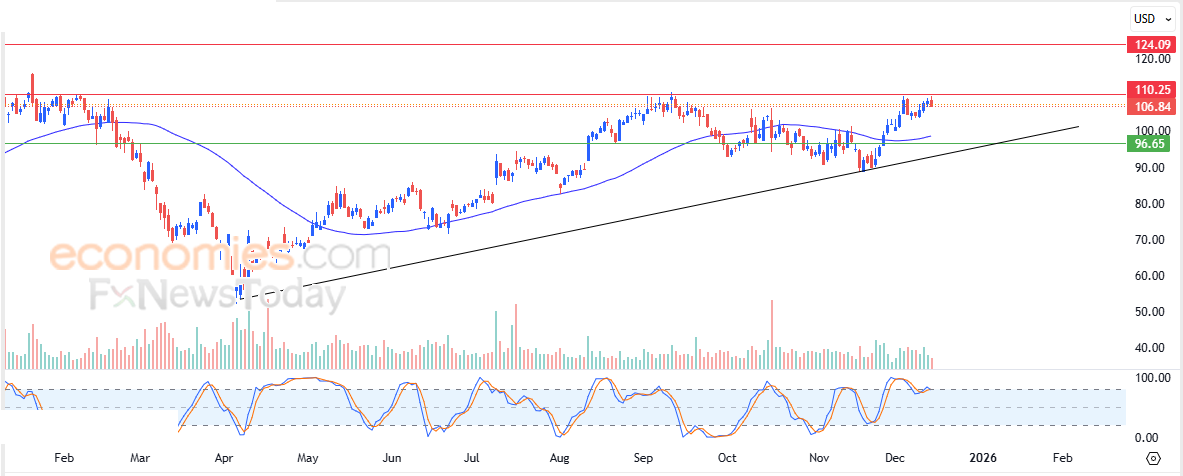
United Airlines Holdings, Inc. (UAL) declined slightly in its latest intraday trading after the pivotal resistance level at $110.25 held, as the stock attempts to acquire positive momentum that may help it break through this resistance. This comes while benefiting from dynamic support provided by trading above its previous 50-day SMA, and under the dominance of the main short-term ascending trend, with the price moving alongside a supporting trendline. We also note the arrival of positive signals from the RSI indicators after the stock successfully relieved its overbought saturation.
Therefore we expect the stock to rise in its upcoming trading, especially if it breaks the mentioned resistance at $110.25, targeting thereafter the next resistance level at $124.00.
Today’s price forecast: Bullish
Forecast update for Ethereum -15-12-2025
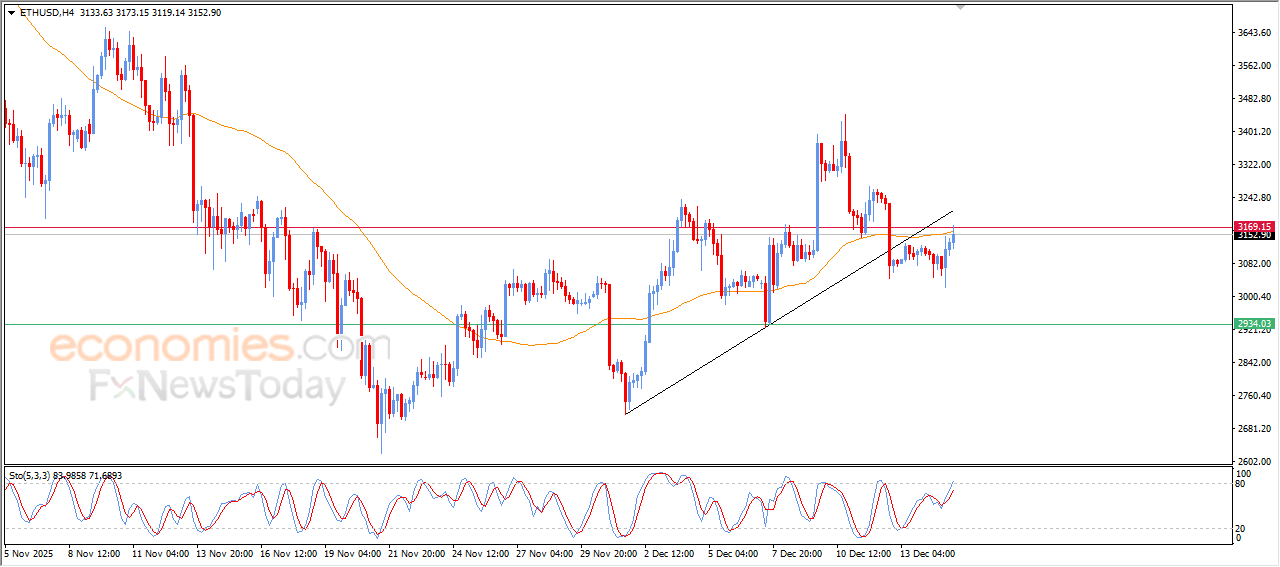
The price of (ETHUSD) extended its cautious gains on the last intraday trading, reaching the resistance of EMA50, reducing the last gains especially with the relative strength indicators overbought levels, exaggeratedly compared to the price movement, to indicate increasing the negative pressure on the price, because of breaking bullish corrective trend line on the short-term basis.
Forecast update for bitcoin -15-12-2025
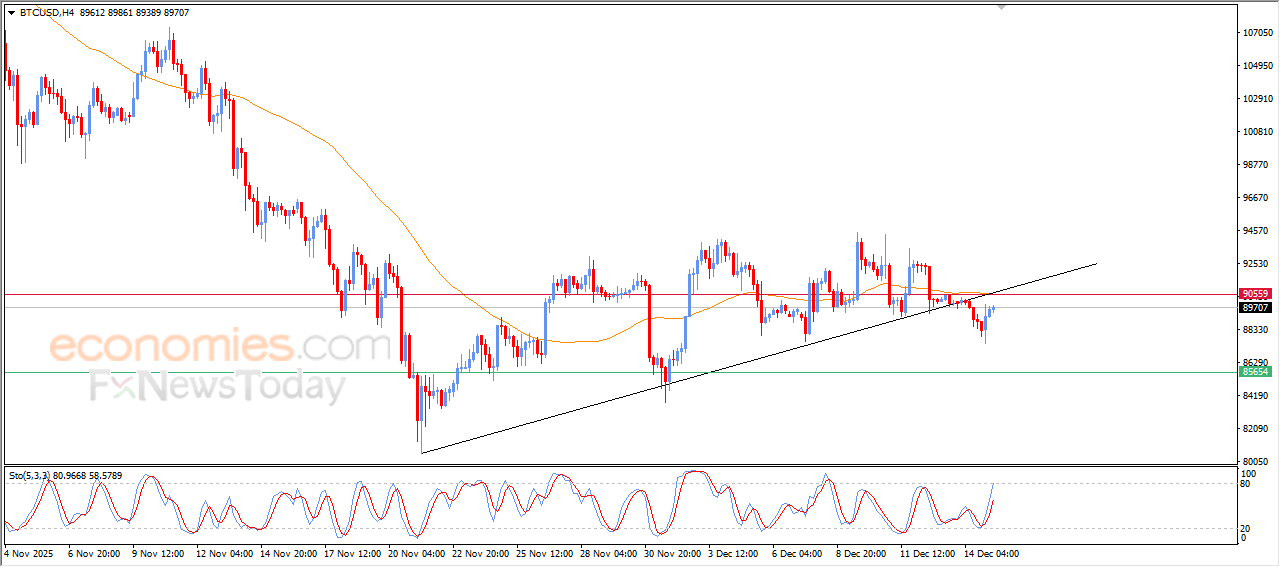
Bitcoin (BTCUSD) prices rose in its last intraday trading, supported by the emergence of positive signals on the relative strength indicators, after reaching oversold levels previously, offloading these conditions especially with entering exaggerated overbought levels, indicating a quick decline to the bullish momentum, affected by breaking bullish corrective trend line on the short-term basis, and there is dynamic pressure that is represented by its trading below EMA50, reducing the chances of a recovery.