Duolingo price faces negative outlook - Forecast today - 17-02-2026
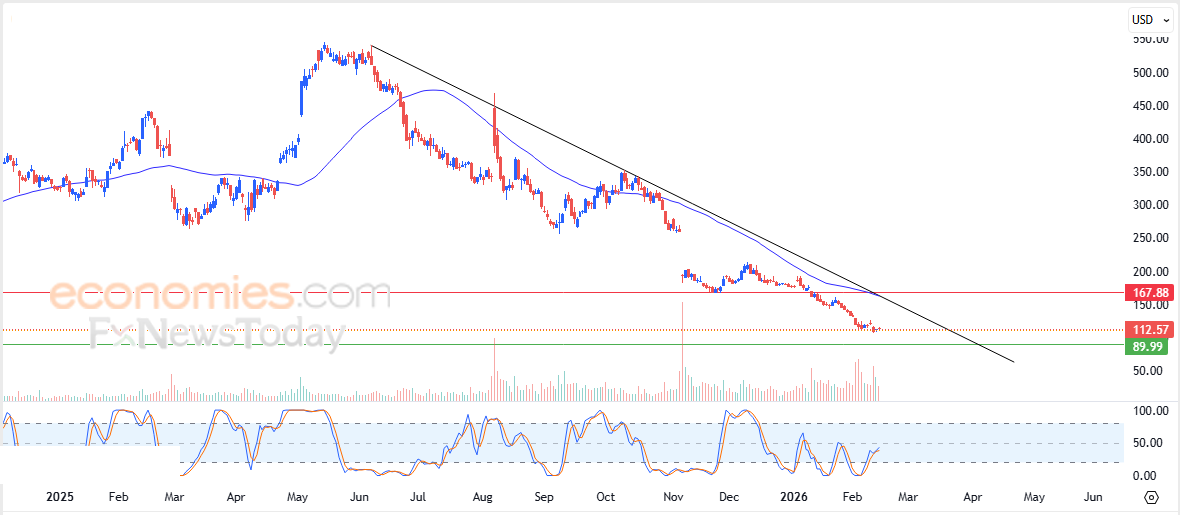
Duolingo, Inc. (DUOL) stock price recorded deeper losses in its latest intraday trading, under full control of the medium-term main downtrend, while moving alongside a downward-sloping trend line. The stock remains under negative pressure as it trades below the 50-day SMA, which reinforces bearish momentum. Technical indicators are also turning negative, with RSI beginning to show a bearish crossover after previously unwinding its oversold condition.
Therefore we expect the stock price to decline in upcoming trading, targeting the first support level at $90.00, with strong chances of breaking below it.
Today’s price forecast: Bearish
Fortinet price readies to tackle pivotal resistance - Forecast today - 17-02-2026
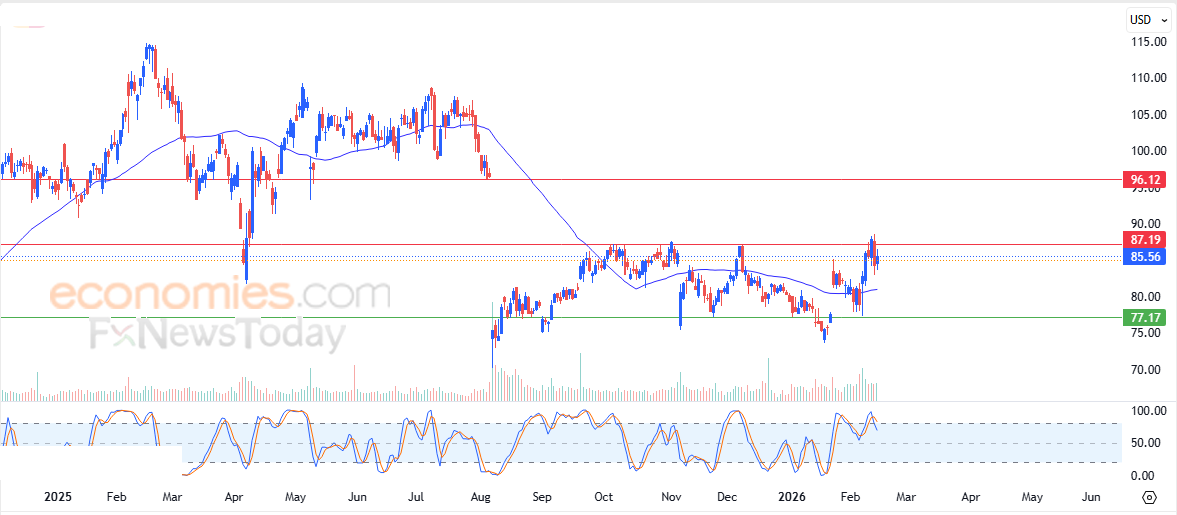
Fortinet, Inc. (FTNT) stock price recorded gains in its latest intraday trading, preparing to attack the stubborn key resistance at $87.20, as a short-term corrective upward wave remains in control. Price continues to trade above the 50-day SMA, which provides dynamic support and increases the chances of a resistance breakout. However, RSI has started to show emerging negative signals, which may act as a near-term obstacle to further upside momentum.
Therefore we expect the stock price to rise in upcoming trading, provided that it first breaks above the $87.20 resistance level, targeting the next resistance at $96.00.
Today’s price forecast: Bullish
+5005 Pips Across Gold, Dow Jones, Nasdaq, Oil and Major FX Pairs: BestTradingSignal.com Weekly Results – 9–13 February 2026

Discover the weekly performance of BestTradingSignal.com signals for 9–13 February 2026, with a net result of +5005 pips across gold, Dow Jones, Nasdaq, USOIL and major forex pairs, plus a high pips‑based success rate.
Strong Weekly Performance: +5005 Pips in One Week
BestTradingSignal.com continues to focus on transparent, numbers‑based reporting rather than empty marketing claims. During the week of 9–13 February 2026, the premium signals account delivered a net result of +5005 pips, generated from a diversified set of instruments including gold, indices, oil and major forex pairs. This kind of diversification helps traders capture opportunities in different markets instead of relying on a single pair or instrument.
Weekly Net Performance (9–13 Feb 2026)
The signals during this week were based on a mix of technical and fundamental setups, aiming to capture high‑probability moves while keeping risk under control. When all trades are combined, the final outcome for the week stands at +5005 net pips.
Net pips per instrument:
Dow Jones:
The Dow Jones index ended the week at +870 pips net, reflecting profitable opportunities during the main US sessions.
Nasdaq:
Nasdaq signals produced +530 pips net, taking advantage of volatility in technology stocks and index movements during economic releases.
Gold:
Gold was the star of the week, closing with a net result of +3080 pips, driven by strong moves related to risk sentiment and interest rate expectations.
USOIL:
USOIL (US crude oil) finished the week at +270 pips net, supported by price swings during inventory data and demand outlook changes.
USDJPY:
The USDJPY pair delivered +140 pips net, with trades aligned to changes in US yields and Bank of Japan policy expectations.
GBPUSD:
GBPUSD closed the week at +40 pips net, despite intraday volatility around UK and US economic data.
EURUSD:
EURUSD added +50 pips net, contributing steady but moderate gains to the overall basket.
S&P:
The S&P index finished with +25 pips net, further diversifying the index side of the portfolio.
These figures represent the net result for each instrument after subtracting losing trades from winning trades, giving traders a realistic picture of how each market contributed to the final weekly total.
Pips‑Based Success Rate: Focusing on Net Pips, Not Just Win Rate
Many traders focus only on the number of winning trades, but a more meaningful metric is how many net pips the strategy gains over time. For this particular week, the net result of +5005 pips comes with a pips‑based success rate of around 99% in terms of pips.
This means that, relative to the total movement of pips across winning and losing trades, the majority of net pips remained on the profitable side. There were losing trades, as in any real trading strategy, but their size was kept under control compared to the winning trades, allowing the total weekly outcome to stay strongly positive.
Why This Weekly Report Matters for Serious Traders
Transparent numbers:
Performance is presented in clear net pips per instrument, rather than vague claims or cherry‑picked trades.
Diversified exposure:
Gold, indices, oil and major FX pairs are covered, giving traders multiple opportunities throughout the trading week.
Emphasis on risk management:
The presence of losing trades is natural; what matters is that risk is limited and the strategy aims to keep the net result positive over time.
Trackable performance over weeks and months:
Weekly reports like this allow traders to monitor consistency instead of judging the service based on a single day or a single trade.
How to Join the Next +Pips Week with BestTradingSignal.com
If you want to follow the upcoming signals in real time and potentially ride the next strong move in gold, indices, oil or FX, you can join the premium channels through the official Telegram bot:
Subscription bot:
https://t.me/BestTradingSignalCom_bot
Monitoring these weekly performance updates over time helps traders see how the strategy behaves across different market conditions. Instead of chasing random setups, BestTradingSignal.com focuses on structured signals, predefined entries, clear stop‑loss and take‑profit levels, and an overall objective: building net pips week after week.
The EURGBP fluctuates below the barrier– Forecast today – 17-2-2026
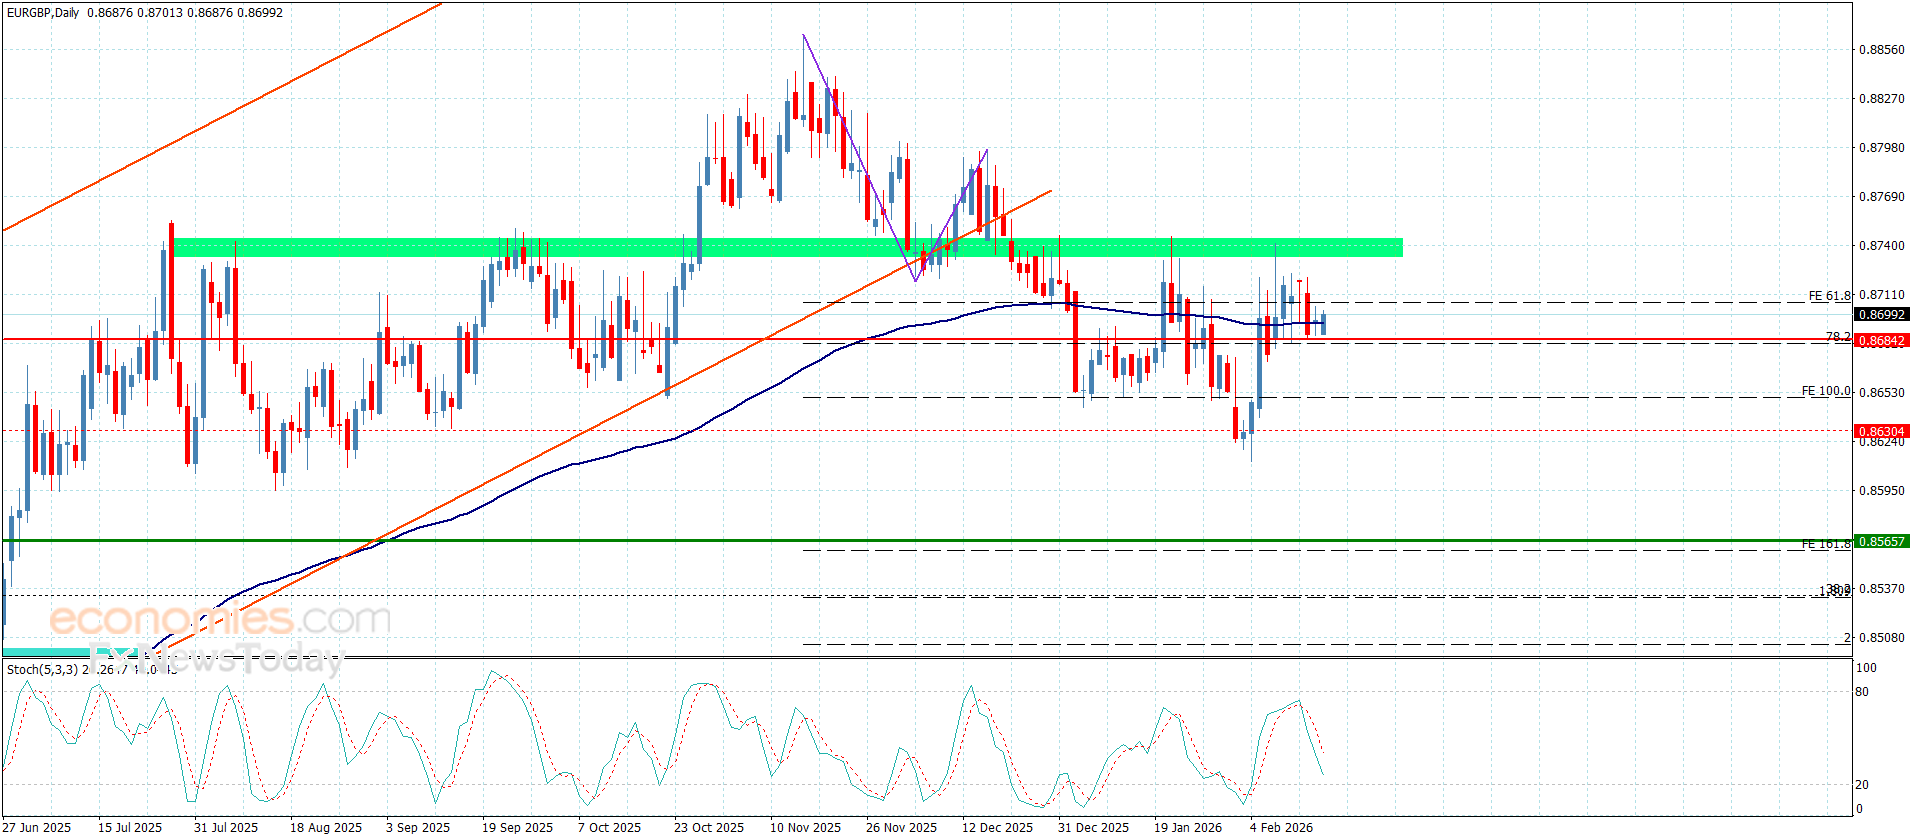
The EURGBP attempted to reduce the previously achieved losses by forming bullish corrective waves, to settle near 0.8700, maneuvering EMA50 as appears in the above image.
Note that the negative stability below 0.8740 barrier forms a main factor to confirm the continuation of the negativity in the upcoming trading, besides stochastic decline below 50 level will provide negative momentum, to keep our bearish expectations which might target 0.8670 and 0.8655 level.
The expected trading range for today is between 0.8670 and 0.8715
Trend forecast: Bearish