Dow Jones Outlook for 2025: Investment Opportunities or an Upcoming Bubble?

Will the Dow Reach 50,000 Points for the First Time in History
With the continued upward momentum in the financial markets, the question arises whether the Dow Jones Industrial Average could reach 50,000 points in the near future.
Despite the index setting new record highs in 2024, sustaining this rally requires a set of economic and political factors that bolster market optimism.
Key Requirements to Achieve This Milestone
- Supportive Monetary Policies and Strong Economic Growth: The Dow could hit 50,000 points if the Federal Reserve adopts an accommodative monetary policy, cuts interest rates, and ends quantitative tightening, alongside robust American economic growth and easing inflation.
- Strong Corporate Earnings and a Thriving Technology Sector: Robust financial results from major companies such as Apple, Microsoft, JPMorgan Chase, and Boeing, as well as expansion in the artificial intelligence and advanced technology sectors, would help drive the index upward.
- Global Market Stability and Strong Investment Flows: A decrease in geopolitical tensions and continued investor appetite for stocks via ETFs would reinforce market confidence.
Does the Dow Enter a Bearish Correction Cycle to Retest 40,000 Support?
Despite the index's strong performance last year, factors such as tightening monetary policy, escalating geopolitical tensions, and declining earnings of major companies could trigger a sharp correction, pushing the index to test the 40,000 point level again.
- Tightening Monetary Policy: If the Fed keeps interest rates high for an extended period, economic activity may slow and borrowing costs could increase.
- Escalating Geopolitical and Trade Tensions: Renewed tensions between the United States and China or an escalation of international crises could increase uncertainty and drive investors towards safe-haven assets.
- Declining Earnings of Major Companies: A drop in earnings from companies such as Apple and Microsoft could trigger a broad sell-off in the index.
Trump’s Trade Policies
With Donald Trump’s return to the White House in 2025, his trade policies have begun reshaping the economic landscape; he has imposed new tariffs on Chinese and European imports, creating trade tensions that negatively affected multinational companies listed in the index.
Although some sectors such as energy and defense benefit, additional tariffs have increased inflationary pressures, and the Federal Reserve has maintained a tight monetary policy, which has driven up borrowing costs.
Federal Reserve Directions
The Federal Reserve faces a delicate balancing act amid inflationary pressures and economic uncertainty; any rate cuts could channel liquidity into the stock market and support the index, while tightening monetary policy might trigger a sharp correction and force a retest of 40,000 points.
About the Dow Jones Industrial Average
The Dow Jones Industrial Average is one of the most important stock market indices on the New York Stock Exchange, tracking the performance of 30 of Wall Street’s largest industrial companies. Established in 1896, it serves as a gauge of the health of the American economy.
- Index History: Founded in 1896 by Charles Dow and Edward Jones.
- Calculation Method: It is calculated by summing the prices of the component stocks and dividing by a divisor that is periodically adjusted.
- Index Importance: It is used as a primary indicator to measure the performance of the U.S. market and the overall health of the economy.
Components of the Dow Jones
- Composition: It consists of 30 major companies from various sectors such as technology, healthcare, and finance.
- Company Selection: Companies are chosen based on their size, liquidity, and significance to the U.S. economy.
- Periodic Review: The list is periodically reviewed to remove underperforming companies and replace them with stronger ones.
List of Companies in the Dow Jones
- Apple (AAPL)
- Microsoft (MSFT)
- Johnson & Johnson (JNJ)
- ExxonMobil (XOM)
- Boeing (BA)
- Nike (NKE)
- JPMorgan Chase & Co. (JPM)
- Caterpillar (CAT)
- Home Depot (HD)
- UnitedHealth Group (UNH)
- Coca-Cola (KO)
- Intel (INTC)
- Procter & Gamble (PG)
- Verizon Communications (VZ)
- Walmart (WMT)
- Bank of America (BAC)
- Pfizer (PFE)
- IBM (IBM)
- Abbott Laboratories (ABT)
- Cisco Systems (CSCO)
- Merck & Co. (MRK)
- Dow Chemical (DOW)
- Walt Disney (DIS)
- Travelers Companies (TRV)
- McDonald’s (MCD)
- 3M (MMM)
- Wells Fargo & Co. (WFC)
Factors Affecting the Dow Jones Industrial Average
- Economic Growth: Rising corporate earnings due to economic growth push the index higher.
- Inflation: High inflation may negatively impact corporate profits.
- Interest Rates: The impact of rising or falling interest rates on borrowing costs.
- Geopolitical Factors: International events and conflicts affect investor confidence.
- Performance of Listed Companies: Strong financial reports boost the index’s value.
- Investor Sentiment: Positive sentiment and confidence drive buying activity.
- Technical Factors: Technical analysis and trading algorithms influence market movements.
Key Price Milestones of the Dow Jones Industrial Average
- August 1896: Recorded an all-time low of 28.66 points.
- December 2024: Recorded an all-time high of 45,073 points.
- August 1896: Recorded an all-time closing low of 31.97 points.
- December 2024: Recorded an all-time closing high of 45,014 points.
Best and Worst Performance of the Dow Jones Industrial Average in History
- Best Performance: In 1915, the index rose by 82%; in Q1 1933, it rose by 77%; in August 1932, it rose monthly by 36%.
- Worst Performance: In 1931, it fell by 53%; in Q2 1932, it fell by 42%; in September 1931, it experienced a monthly drop of 31%.
Dow Jones Forecasts for 2025
- Goldman Sachs: Expects the index to reach 48,000 points by the end of 2025.
- Bank of America: Forecasts continued gains with a range between 46,000 and 48,000 points.
- Morgan Stanley: Expects the index to reach 47,000 points by year’s end.
- Deutsche Bank: Predicts the index will climb to 50,000 points before the end of the year.
- Citigroup: Expects the index to close 2024 at 48,000 points.
Factors Affecting Dow Jones Forecasts
Factors influencing the Dow include macroeconomic conditions, monetary and fiscal policies, geopolitical situations, the performance of major companies, investor sentiment, innovation and technology, and unforeseen events such as natural disasters and global crises.
Top FAQs About the Dow Jones
Is the Current Dow Level Suitable for Investment?
The index is trading near its all-time high (around 45,000 points), which entails high risk, although lower interest rates may mitigate that risk.
How to Invest in the Dow Jones?
There are several ways to invest in the Dow, including:
- Investing through Exchange-Traded Funds (ETFs), such as the SPDR Dow Jones Industrial Average (DIA).
- Buying individual stocks of the companies included in the index.
- Investing in mutual funds that invest in those companies.
- Using futures and options contracts for professional investors.
Will the Dow Crash in 2025?
It is unlikely to crash this year, especially given that it comprises high-quality stocks closely tied to the performance of the American economy.
Technical Analysis of the Dow Jones (Dow Jones)
The Dow Jones Industrial Average embarks on a long-term bullish journey, as illustrated by the chart below, having recorded an all-time high reaching approximately 45,150 points. It then encountered strong resistance there, which forced a modest downward correction, and is now attempting to resume its upward movement near that peak.

The 50-day moving average provides underlying support for the industrial index, enhancing the prospects for the continuation of the bullish trend. However, there is an alternate view in which the index’s recent inability to break above that peak might indicate a negative technical setup, potentially forcing a short- to medium-term correction, as shown in the daily chart scenario.

Should the index fail to surpass the 45,150-point level, it may initiate a downward wave targeting the 23.6% Fibonacci retracement level calculated from 28,643.05 up to the aforementioned peak. A closer examination of the daily chart reveals that reaching this level could lead the index to form a double-top pattern, which would trigger further short-term correction with the next target around 38,846.50 as a subsequent downside milestone.
The pivotal points to watch are support at 44,000 and resistance at 45,150; a break below this support would confirm the start of a bearish correction and the potential completion of the negative pattern, whereas a break above resistance would allow the index to resume its main upward trend.
Furthermore, on the intraday timeframes, the index is confined within a symmetrical triangle pattern since the end of last month. A break above the triangle’s resistance at 44,740 would serve as the first positive catalyst for a return to the primary bullish trend and nullify any negative potential affecting the index.

Overall, the long-term upward trend remains in place and active, and the index needs to break through levels of 44,740 and then 45,150 to pave the way for new historic highs that could reach 46,000 and then 46,500 points in the coming period. Conversely, a break below 44,000 will put the index under downward pressure and shift the short-term and intraday trend toward a decline, potentially testing support levels around 41,260 initially; breaking this support would confirm an extended bearish correction targeting 38,846.50 as the next downside objective.
Finally, the key technical analysis indicates that the long-term bullish trend is likely to continue if the index can overcome these obstacles. Securing levels above 44,740 followed by 45,150 will open the door to achieving new historic levels, while a break below 44,000 would signal a shift to a bearish path.
On the other hand, if the index fails to confirm a breach of 78.90 (note: this figure appears to be an error in the original text and is likely unrelated to the Dow) and instead experiences a downward rebound breaking the 74.60 level (another unrelated figure), it will force a transition into a downtrend with additional losses potentially reaching levels around 23,375 before any new attempt to rise. (These figures seem to be mixed with other asset analyses and might require further clarification.)
The GBPCAD keeps the bullish track – Forecast today – 20-2-2025
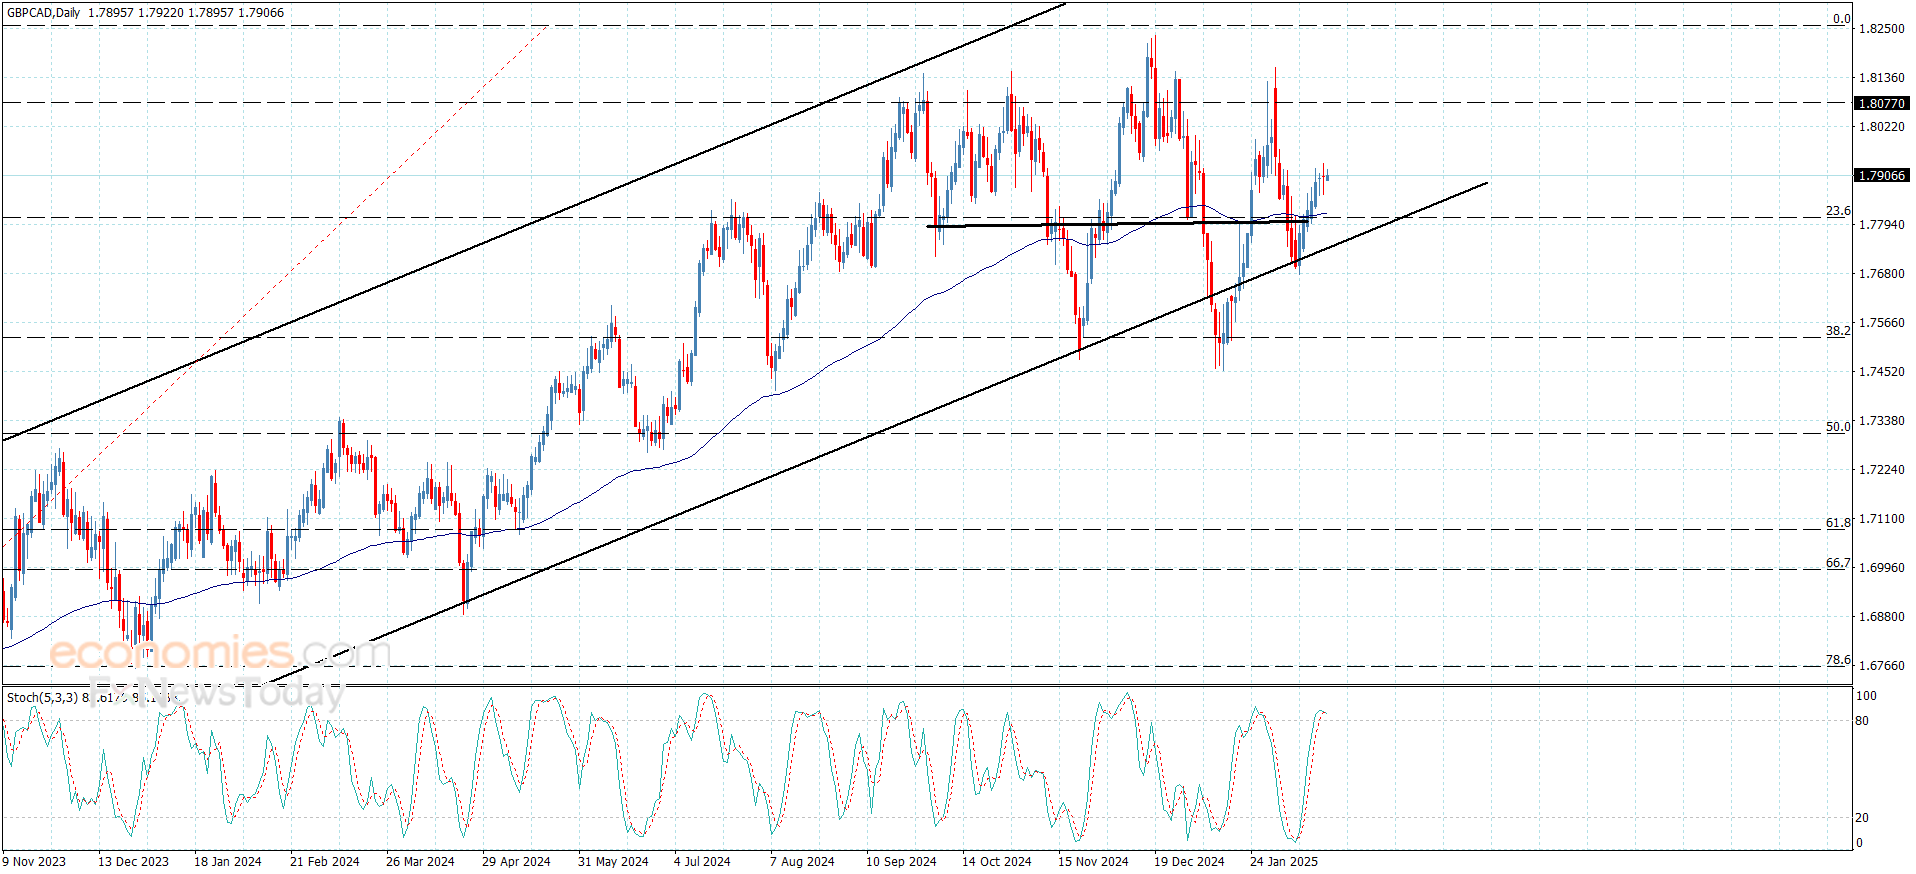
The GBPCAD price provided many positive closings above the additional support at 1.7815, to keep its stability within the bullish channel to notice its fluctuation near 1.7910 now.
Note that stochastic crawl towards the overbought areas will increase the positive pressures on the price to provide the chance to record additional gains that might start at 1.7980 followed by reaching 1.8070 on the medium-term basis.
The expected trading range for today is between 1.7870 and 1.7980
Trend forecast: Bullish
Natural gas price resumes the bullish attack – Forecast today – 20-2-2025
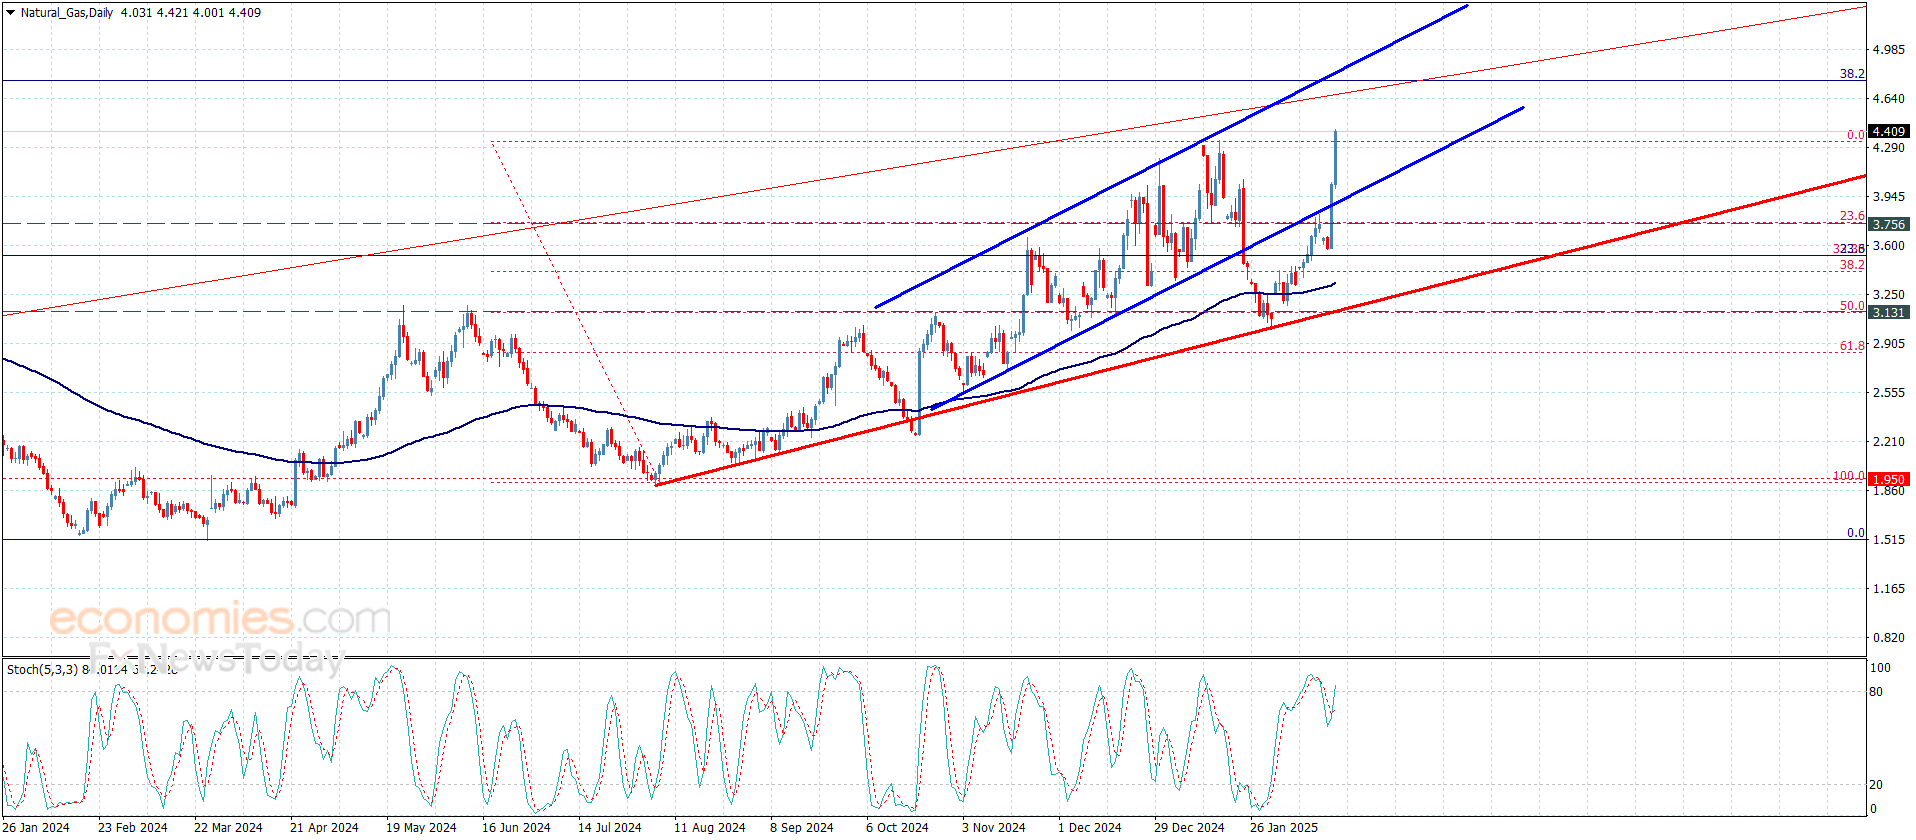
Natural gas price continued to form strong bullish waves yesterday, to notice surpassing 4.330$ barrier and record new gains by touching 4.480$ level.
We will depend on 4.330$ level forming additional support, noting that stochastic crawl towards the overbought areas will increase the positive pressures on the price, to expect targeting 4.650$ level soon, while surpassing it will extend trades towards the bullish channel’s resistance line at 4.810$.
The expected trading range for today is between 3.330$ and 4.650$
Trend forecast: Bullish
The EURJPY continues to decline – Forecast today – 20-2-2025

The EURJPY pair attacked the additional support at 157.30 this morning, to hint confirming the bearish scenario and settle near 156.80 now.
The continuous negative momentum provided by the major indicators will push the price to provide more negative attempts, to expect moving towards 155.40 soon, while breaking this obstacle might force the price to suffer additional losses by crawling towards the bearish channel’s support line at 153.75.
The expected trading range for today is between 155.40 and 157.80
Trend forecast: Bearish