Docusign price touches SMA resistance - Forecast today - 25-08-2025
AI Summary
- DocuSign, Inc (DOCU) stock price touched resistance at its 50-day simple moving average
- RSI indicators show heavily overbought levels, signaling a negative divergence and potential bearish pressure
- Forecast predicts a decline in stock price as long as it remains below the resistance level of $79.28, targeting key support at $67.30
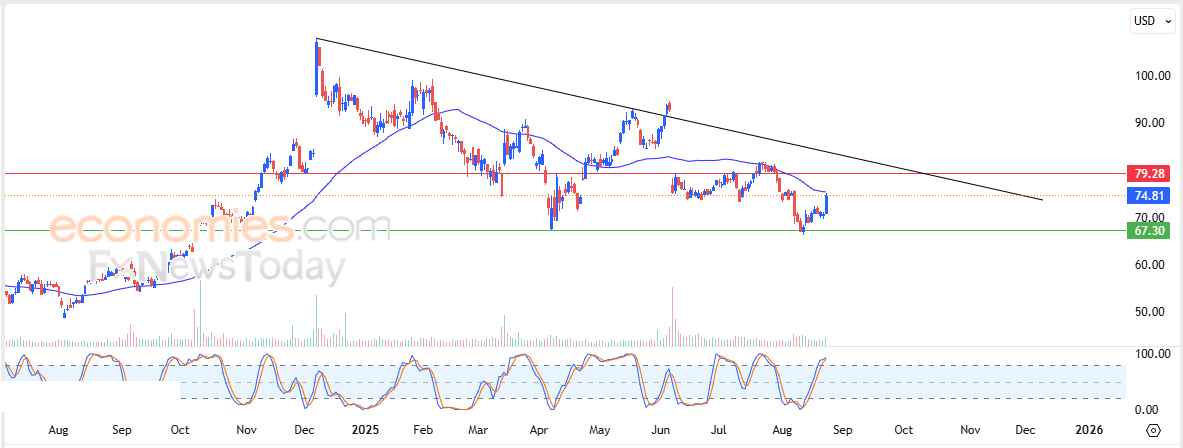
DocuSign, Inc (DOCU) stock price jumped in its latest intraday trading, as the stock attempted to recover part of its previous losses. With this rise, the price touched resistance at its 50-day simple moving average, while still trading under the control of a short-term corrective downtrend along a descending trendline. In addition, RSI indicators have reached heavily overbought levels, in an exaggerated manner compared with the price movement, signaling the start of a negative divergence that could intensify the surrounding bearish pressure.
Therefore, we expect the stock price to decline in its upcoming trading, as long as it remains below the resistance level of $79.28, targeting again the key support level at $67.30.
Today's price forecast: Bearish
Forecast update for Ethereum -25-08-2025
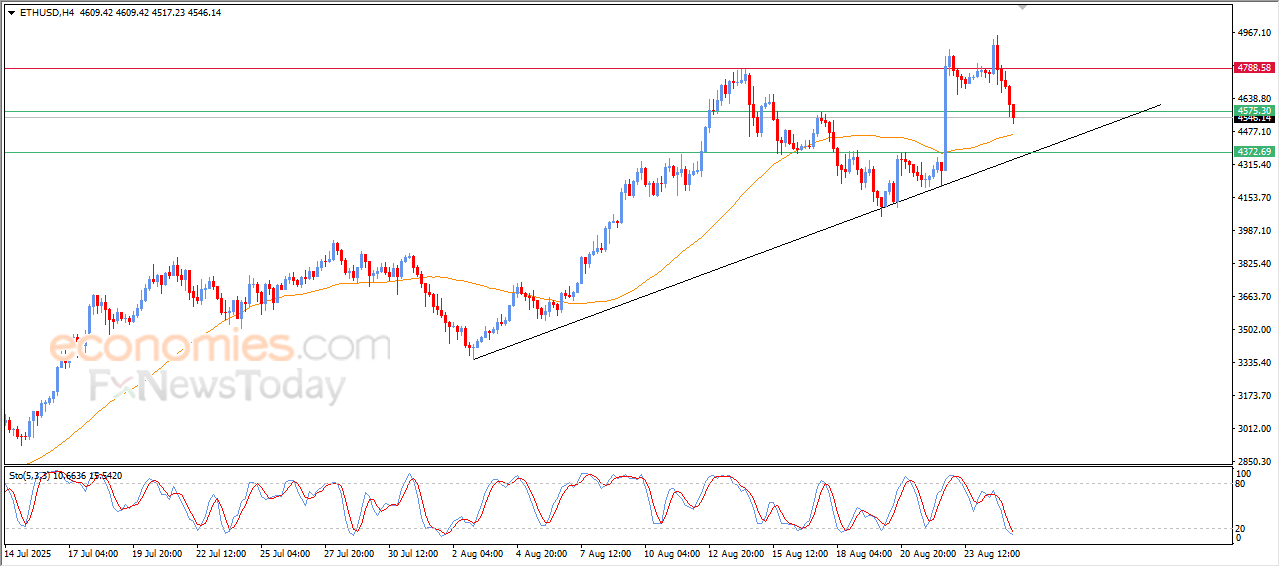
The price of (ETHUSD) kept declining in its last intraday trading, attempting to look for a rising low to take it as a base to help it to gain the required bullish momentum to recover and rise again, amid the continuation of the positive support that comes from its trading above EMA50, and under the dominance of the main bullish trend and its trading alongside a supportive bias line for this trend, besides the (RSI) reach to the oversold levels, suggesting the beginning of forming a positive divergence.
VIP Trading Signals Performance by BestTradingSignal.com (August 18–22, 2025)
BestTradingSignal.com – Professional Trading Signals with high accuracy. Subscribe now to tailored packages for the world’s leading markets and receive signals instantly via Telegram from an expert team:
US Stock Signals from €44/month
Subscribe via TelegramCrypto Signals from €49/month
Subscribe via TelegramForex Signals from €49/month
Subscribe via TelegramVIP Signals (Gold, Oil, Forex, Bitcoin, Ethereum, Indices) from €179/month
Subscribe via TelegramCheck full VIP signals performance report for the week of August 18–22, 2025: Full Report
Forecast update for Bitcoin -25-08-2025
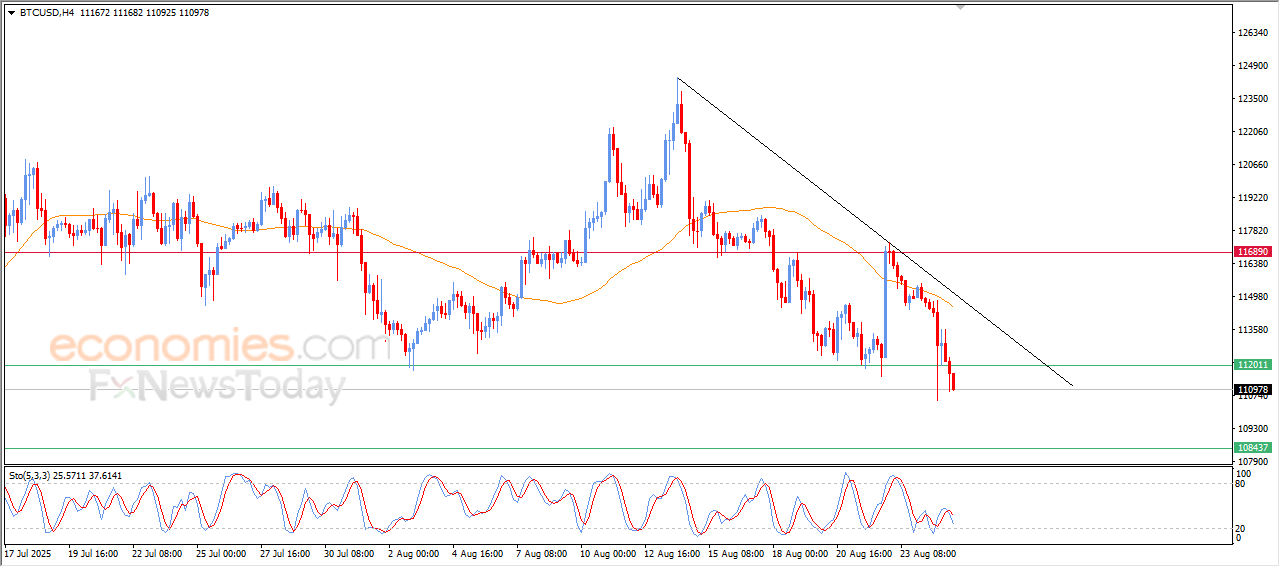
The price of (BTCUSD) deepened its losses in its last intraday trading, to break the critical support level at $112,000, amid the continuation of the negative pressure that comes from its trading below EMA50 and under the domination of the bearish trend on the short-term basis, and its trading alongside a supportive bias for this trend, besides the emergence of the negative signals on the (RSI), after its success in offloading its oversold conditions in its early trading, increasing the negative pressure, opening the way for recording more of the losses on the near-term basis.
VIP Trading Signals Performance by BestTradingSignal.com (August 18–22, 2025)
BestTradingSignal.com – Professional Trading Signals with high accuracy. Subscribe now to tailored packages for the world’s leading markets and receive signals instantly via Telegram from an expert team:
US Stock Signals from €44/month
Subscribe via TelegramCrypto Signals from €49/month
Subscribe via TelegramForex Signals from €49/month
Subscribe via TelegramVIP Signals (Gold, Oil, Forex, Bitcoin, Ethereum, Indices) from €179/month
Subscribe via TelegramCheck full VIP signals performance report for the week of August 18–22, 2025: Full Report
Forecast update for Brent crude oil -25-08-2025
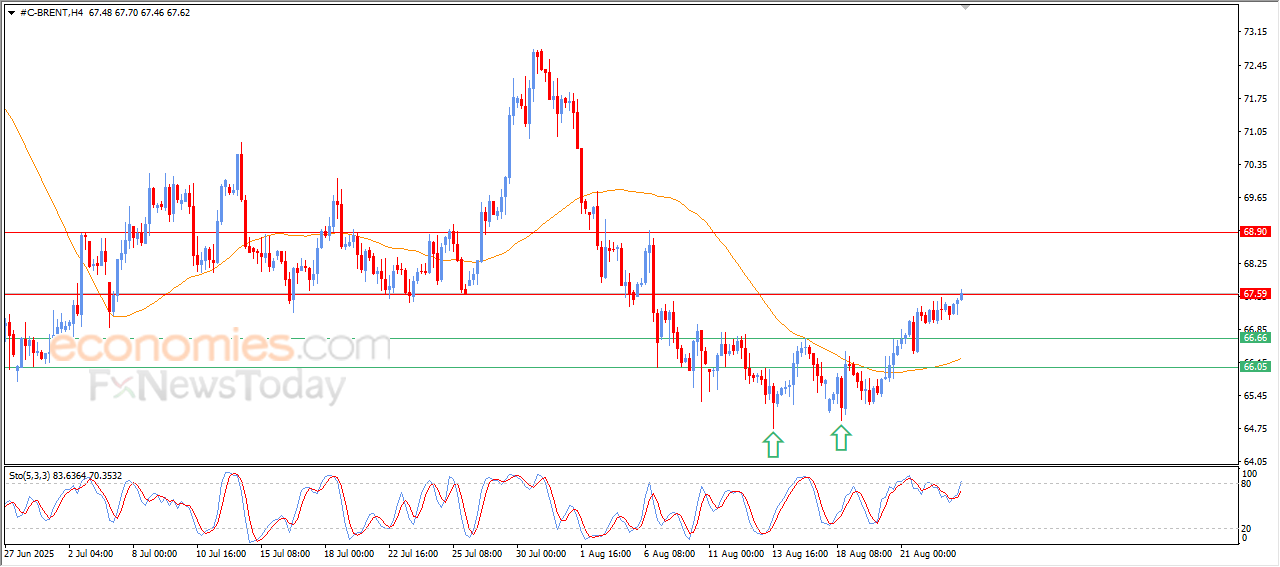
The price of (Brent) rose in its last trading on the intraday levels, attacking our morning the current resistance at $68.60, supported by a positive technical pattern on the short-term basis -the double bottom pattern- amid the continuation of the positive pressure that comes from its trading above EMA50, besides the return of the positive signals on the (RSI), after the price success in offloading its overbought conditions, opening the way for achieving the last gains.
VIP Trading Signals Performance by BestTradingSignal.com (August 18–22, 2025)
BestTradingSignal.com – Professional Trading Signals with high accuracy. Subscribe now to tailored packages for the world’s leading markets and receive signals instantly via Telegram from an expert team:
US Stock Signals from €44/month
Subscribe via TelegramCrypto Signals from €49/month
Subscribe via TelegramForex Signals from €49/month
Subscribe via TelegramVIP Signals (Gold, Oil, Forex, Bitcoin, Ethereum, Indices) from €179/month
Subscribe via TelegramCheck full VIP signals performance report for the week of August 18–22, 2025: Full Report