D.R. Horton price tries to vent off oversold saturation - Forecast today - 31-12-2025
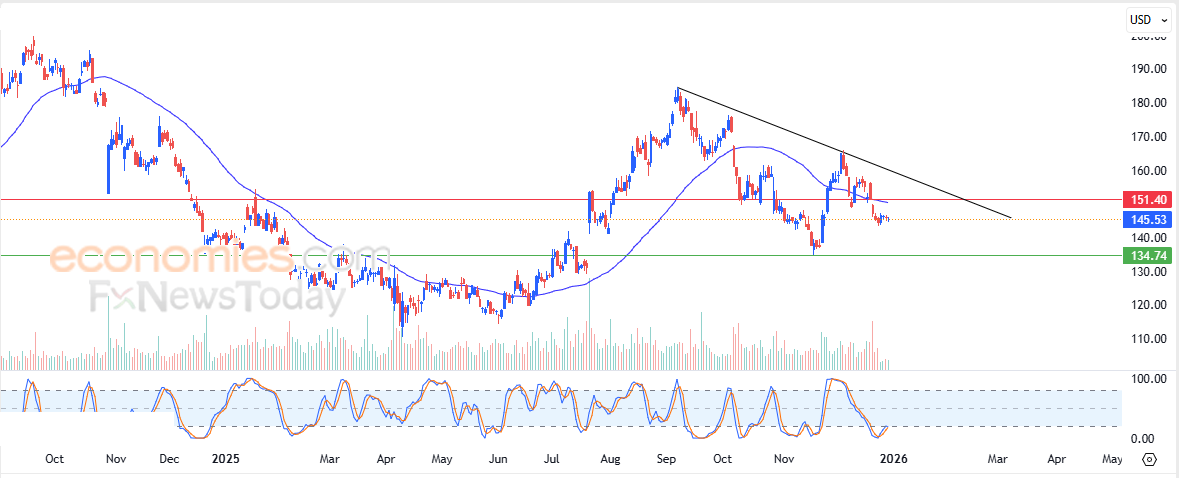
D.R. Horton, Inc. (DHI) showed calm and slightly positive sideways trading in its latest intraday movements, as the stock attempts to recover part of its previous losses. At the same time, it is trying to unwind its clear oversold condition on the RSI, especially with the emergence of early positive signals. This comes amid the dominance of a minor bearish wave in the short term, with price action moving alongside a supporting downward trendline, in addition to ongoing negative pressure from trading below its 50-period SMA.
Therefore we expect the stock price to decline during the upcoming trading sessions, as long as resistance at $151.40 holds, to target the support level at $134.75.
Today’s price forecast: Bearish
Dominion Energy price gives in to negative pressure - Forecast today - 31-12-2025
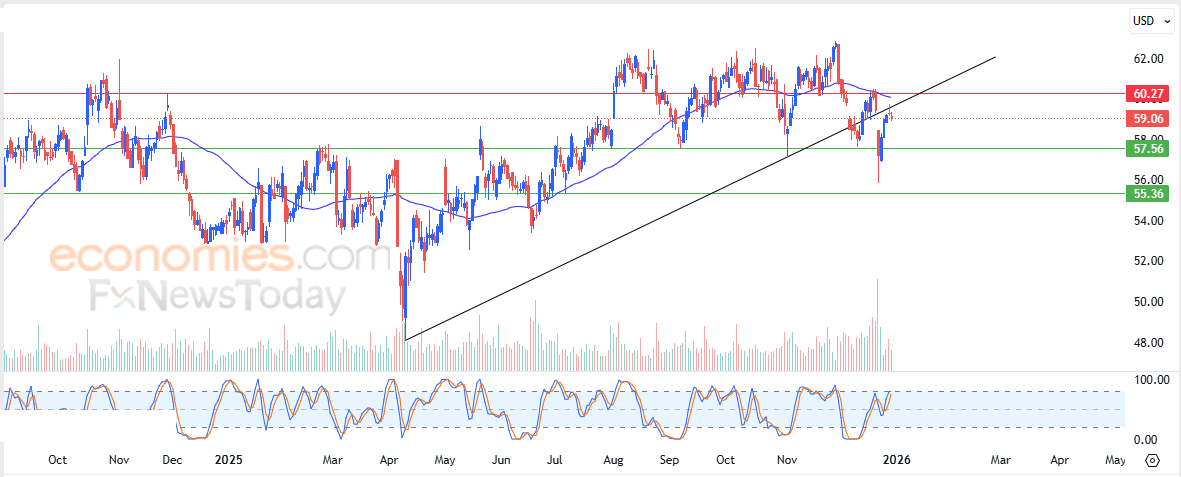
Dominion Energy, Inc. (D) declined in its latest intraday trading, amid continued negative and dynamic pressure from trading below its 50-period simple moving average. This comes while a corrective bearish wave dominates the short term, following the stock’s earlier break of a main ascending trendline. In addition, a bearish crossover is beginning to appear on the RSI after reaching extremely overbought levels.
Therefore we expect the stock price to decline further in the upcoming trading sessions, as long as resistance at $60.25 holds, to target the support level at $57.55.
Today’s price forecast: Bearish
Forecast update for Ethereum -31-12-2025
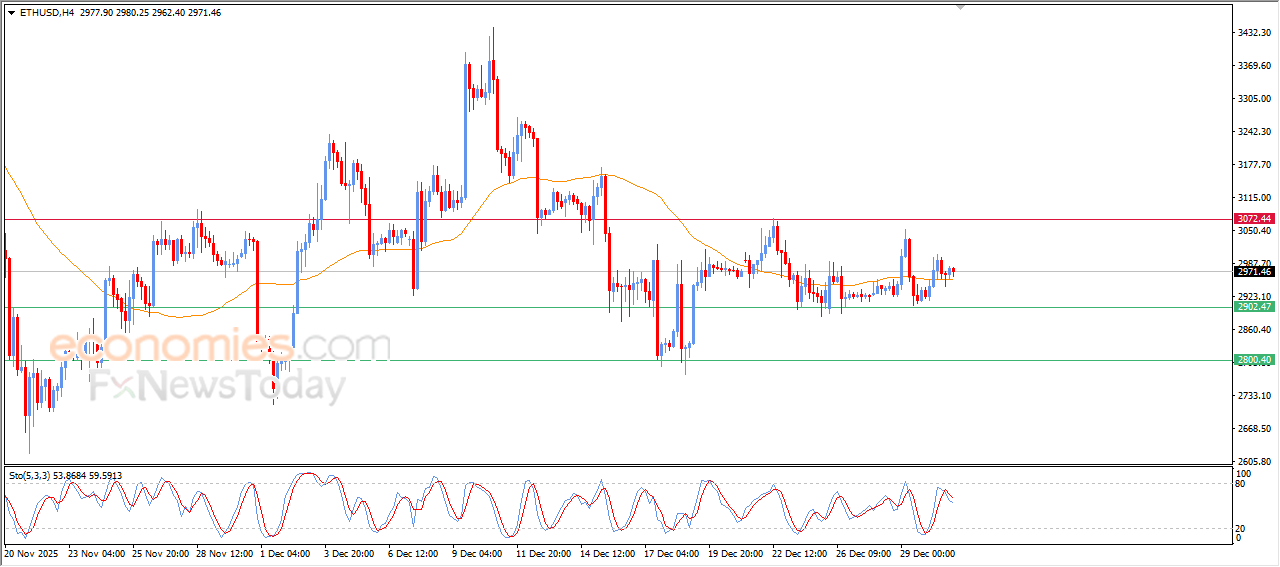
The price of (ETHUSD) declined slightly in the last intraday trading, leaning on the support of its EMA50, in attempt to gain bullish momentum that might help it to rise again, amid the dominance of minor bullish wave on the short-term basis, on the other hand, we notice the emergence of the negative signals from the relative strength indicators, after reaching overbought levels, which adds some uncertainty to the upcoming expectations on the intraday basis.
Forecast update for brent crude oil -31-12-2025
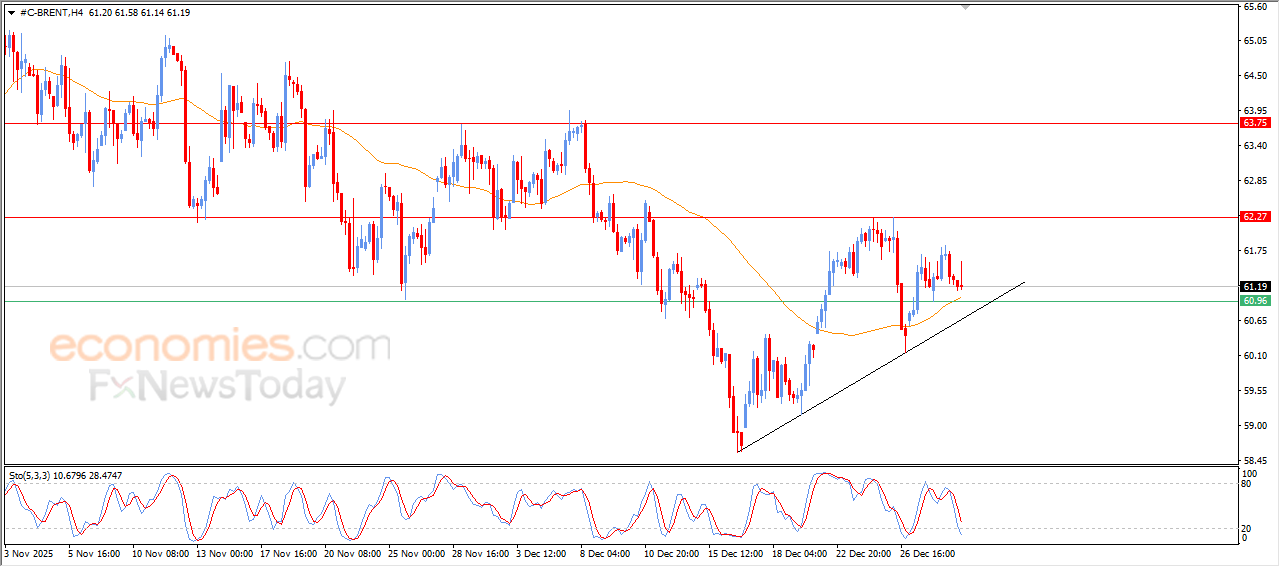
Brent crude oil’s prices couldn’t keep its early gains on its last intraday levels, keeping its attempts to gain bullish momentum that might help it to recover and rise again, amid the continuation of the positive support due to its trading above EMA50, reinforcing the stability of the bullish corrective trend on the short-term basis, especially with its trading alongside trend line, noticing that the relative strength indicators have reached exaggerated oversold levels compared to the price move.