Citigroup price pierces our price target - Forecast today - 17-06-2026
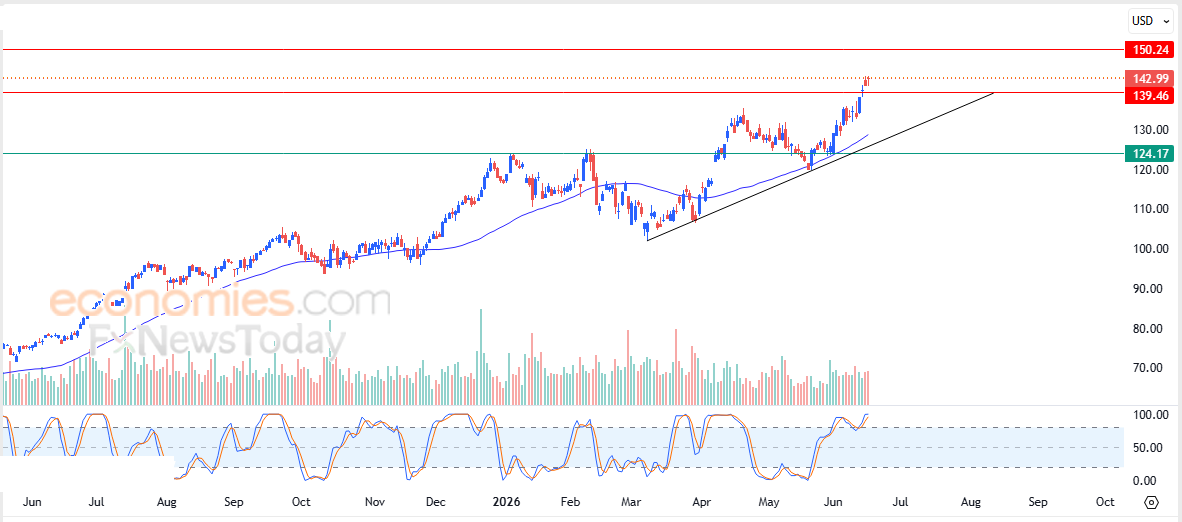
Citigroup, Inc. (C) extended its gains in recent intraday trading, successfully breaking above the $139.50 resistance level, which was our latest upside target in previous analyses. The stock continues to benefit from dynamic support provided by trading above its 50-day Simple Moving Average (SMA), reinforcing the stability and dominance of the primary medium-term bullish trend. Price action also remains aligned with a short-term ascending trendline that continues to support the upward trajectory.
Accordingly, our outlook remains bullish for the stock's upcoming trading sessions, particularly as long as it maintains stability above the $139.50 level. Under this scenario, the next upside target stands at the $150.00 resistance level.
Today's price forecast: Bullish.
Lyft price shakes off negative pressure - Forecast today - 21-06-2026
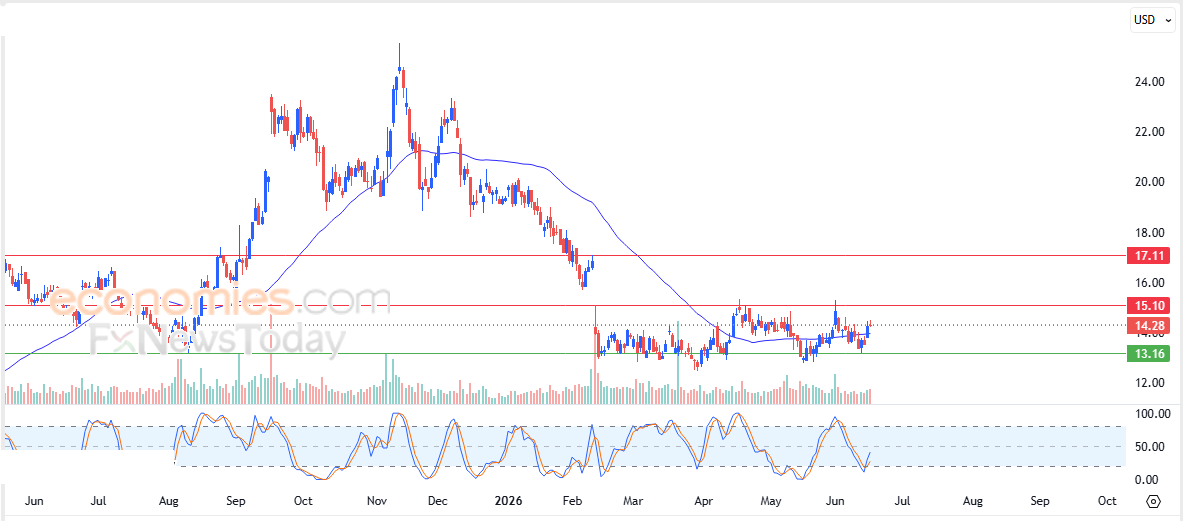
The price of Lyft, Inc. (LYFT) continues to hold on to its recent intraday gains, successfully breaking above its 50-day Simple Moving Average (SMA), allowing the stock to shake off the negative pressure that had weighed on its performance. The stock remains under the influence of a short-term sideways corrective trend, while positive signals are beginning to emerge from the RSI after reaching extremely oversold levels, providing bullish momentum that has supported these recent gains.
Therefore, our outlook suggests further upside potential for the stock in upcoming trading sessions, provided it first succeeds in breaking above the key resistance level at $15.10. A confirmed breakout could pave the way for a move toward the next resistance target at $17.00.
Today's price forecast: Bullish.
Forecast update for Ethereum -17-06-2026
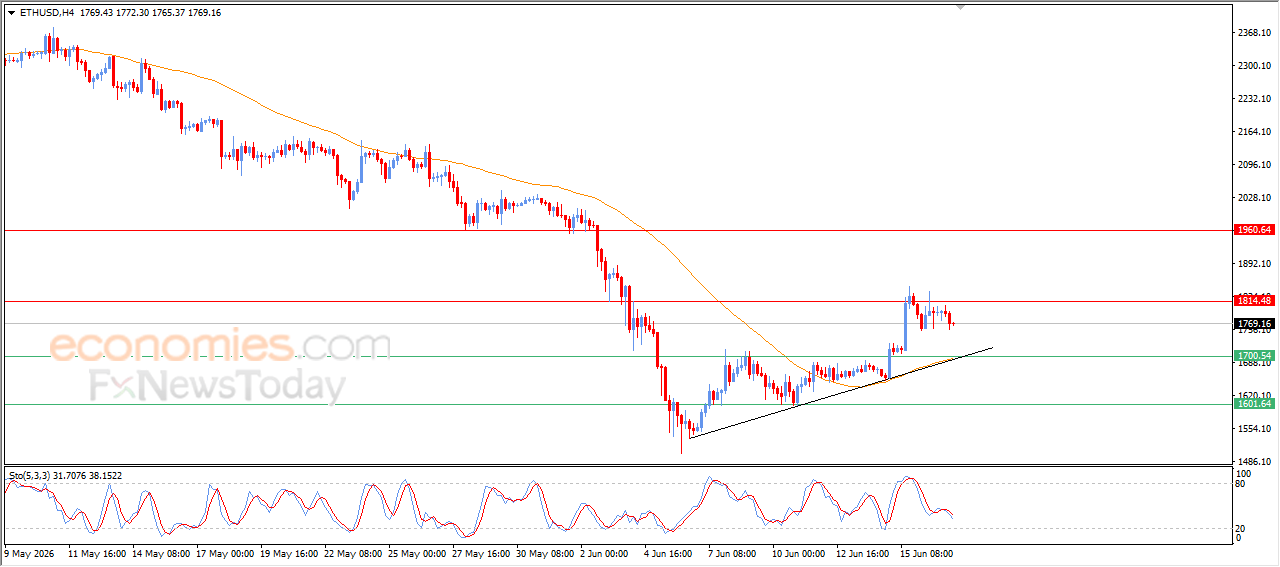
Ethereum (ETHUSD) declined during recent intraday trading, affected by the stability of the key resistance at $1,800, with the emergence of the negative signals from the relative strength indicators, attempting to gain bullish momentum that might help it to breach this resistance, amid the continuation of the dynamic pressure that is represented by its trading above EMA50, which reinforces the dominance and stability of the bullish corrective trend on the short-term basis, with the trading alongside supportive trend line for this path.
Forecast update for Brent -17-06-2026
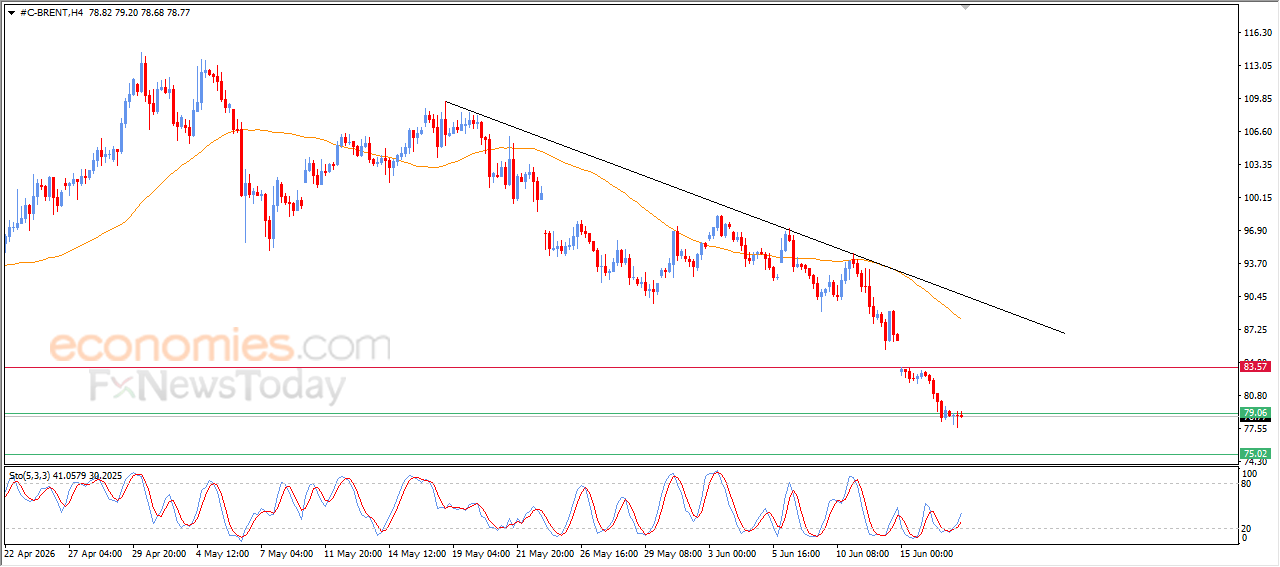
Brent crude oil prices fluctuated in its last intraday trading, attempting to offload its oversold conditions on the relative strength indicators, with the emergence of positive signals from them, attempting to recover some previous losses, amid the dominance of the main bearish trend on the short-term, with its trading below EMA50, representing extra negative pressure.