Baidu price loses positive momentum - Forecast today - 30-04-2026
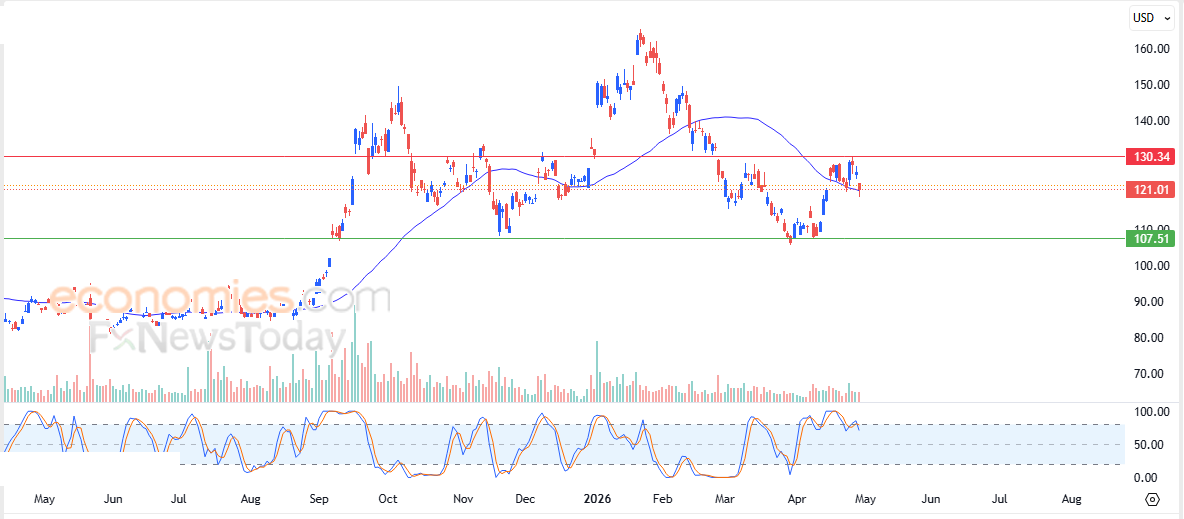
Baidu, Inc. (BIDU) stock price slid lower in its latest intraday trading, amid negative signals from the Stochastic indicator after reaching extremely overbought levels. This occurs under the dominance of a short-term bearish corrective trend, signaling a potential deepening of losses in the near future, especially if the stock breaks below the support of its 50-day SMA, which would double the surrounding negative pressure.
Therefore, our expectations indicate a decline in the stock price during upcoming trading sessions, as long as the resistance level at 130.35 remains intact, targeting the key support level at 107.50.
Today’s price forecast: Bearish
Monster Beverage price driven lower by pivotal resistance - Forecast today - 30-04-2026
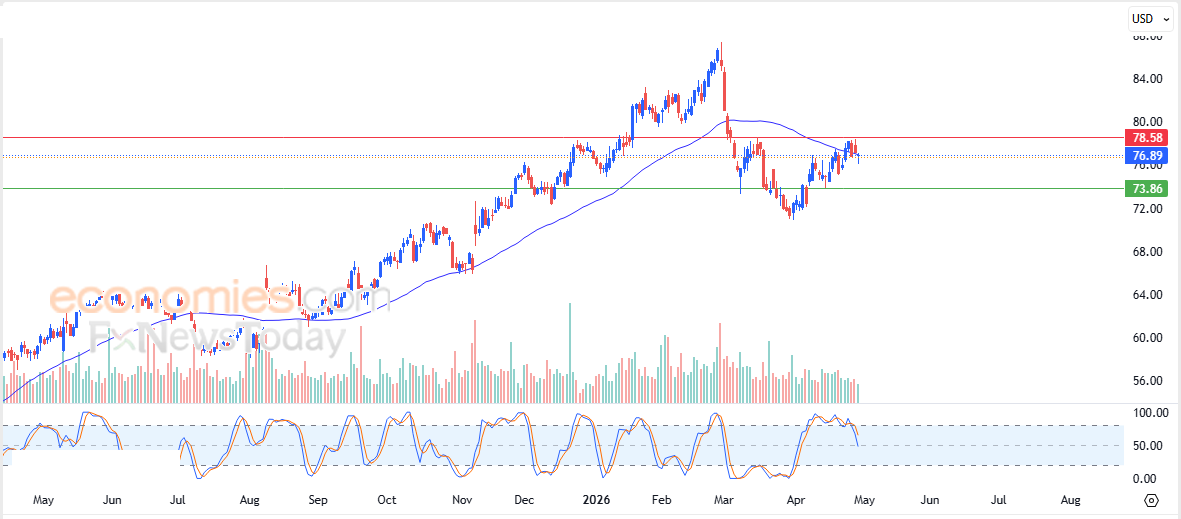
Monster Beverage Corporation (MNST) stock price declined in its latest intraday trading, following the stability of the key resistance level at 78.55. The stock's test of this level coincided with a collision against the resistance of its 50-day SMA, doubling the bearish pressure. This move comes as negative signals begin to emerge from the Stochastic indicator after reaching extremely overbought levels.
Therefore, our expectations indicate a decline in the stock price during its upcoming trading sessions, as long as the aforementioned 78.55 resistance remains intact, targeting the support level at 73.85.
Today’s price forecast: Bearish
ASML price passes SMA support - Forecast today - 30-04-2026
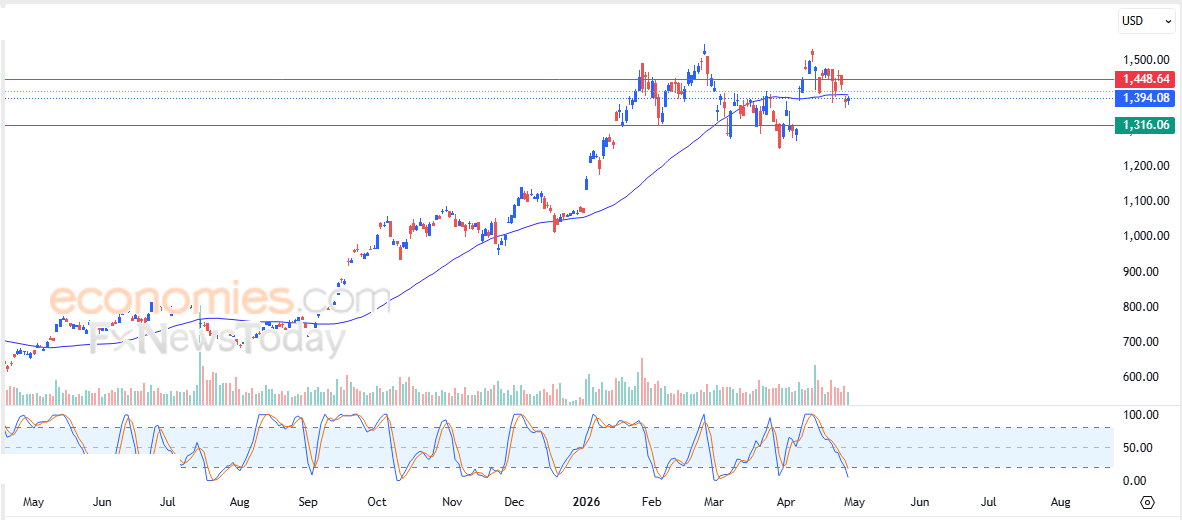
ASML Holding N.V. (ASML) stock price is seeing sharp losses in its latest intraday trading, after breaking below the support of its 50-day SMA. This move has exposed the stock to negative pressure, signaling an intent to continue the corrective downward trend in the near future. This comes alongside negative signals from the Stochastic indicator, despite it reaching deeply oversold levels.
Therefore, our expectations indicate a decline in the stock price during upcoming trading sessions, as long as it remains stable below the resistance level of 1,448.65, targeting the first support level at 1,316.00.
Today’s price forecast: Bearish
Gamestop price tries to gather positive momentum - Forecast today - 30-04-2026
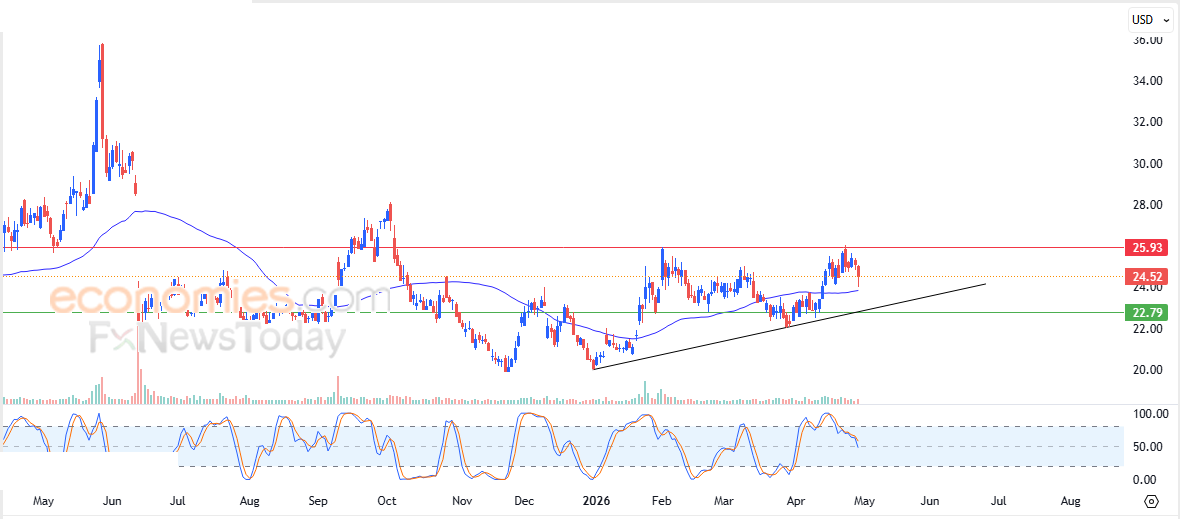
GameStop Corporation (GME) stock price declined in its latest intraday trading, following the stability of the key resistance level at 25.90. This decline represents an attempt to gain positive momentum to help break through that resistance, while simultaneously easing overbought conditions indicated by the Stochastic indicator, especially as negative signals emerge. With this recent drop, the stock has reached the support of its 50-day SMA, amid the dominance of a short-term bullish corrective trend and movement alongside a supporting trendline.
High-Risk Warning: GME is a meme stock, characterized by intense speculative trading. Consequently, its price action often deviates from technical expectations or financial reports and can be highly unpredictable.
Therefore, our expectations lean toward a rise in the stock price during upcoming trading sessions, as long as the support level at 22.80 remains intact, targeting the aforementioned 25.90 resistance level again in preparation to challenge it.
Today’s price forecast: Bullish