AbbVie price regains footing quickly - Forecast today - 24-11-2025
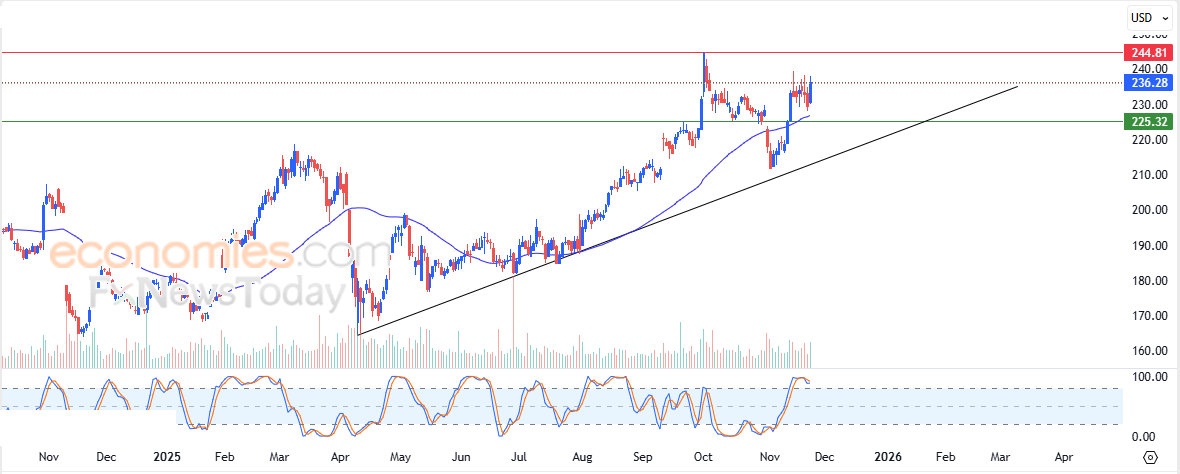
AbbVie (ABBV) jumped higher in its latest intraday trading, supported by ongoing dynamic momentum as the stock continues to trade above its 50-day simple moving average. This comes under the dominance of a primary short-term uptrend, with price action moving along an ascending trendline that reinforces this trajectory. The recent rise followed the stock’s successful unwinding of some of its clearly overbought levels on the Relative Strength Indicators, giving it broader room to extend gains in the coming period.
Therefore, we expect the stock to rise in the upcoming trading sessions, as long as the support level of $225.30 remains intact, targeting the key resistance level of $244.80.
Today's price forecast: Bullish
T-Mobile price suffers from negative pressures - Forecast today - 24-11-2025
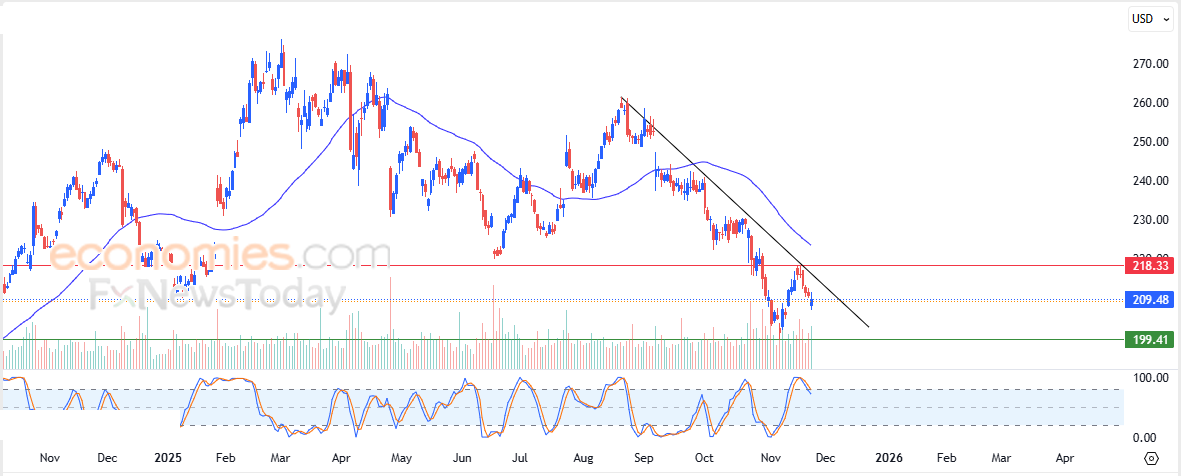
T-Mobile US (TMUS) declined in its latest intraday trading, under the dominance of a primary short-term downtrend with movement aligned to a descending minor trendline supporting this path. Persistent negative pressure continues as the stock trades below its 50-day simple moving average, and additionally, a clear bearish divergence has formed on the Relative Strength Indicators after they reached extremely overbought levels, exaggerated relative to the price action, with fresh negative signals emerging.
Therefore, we expect the stock to decline in the upcoming trading sessions, as long as resistance at the price level of $218.35 remains intact, targeting the key support level of $199.40.
Today's price forecast: Bearish
Forecast update for Ethereum -24-11-2025
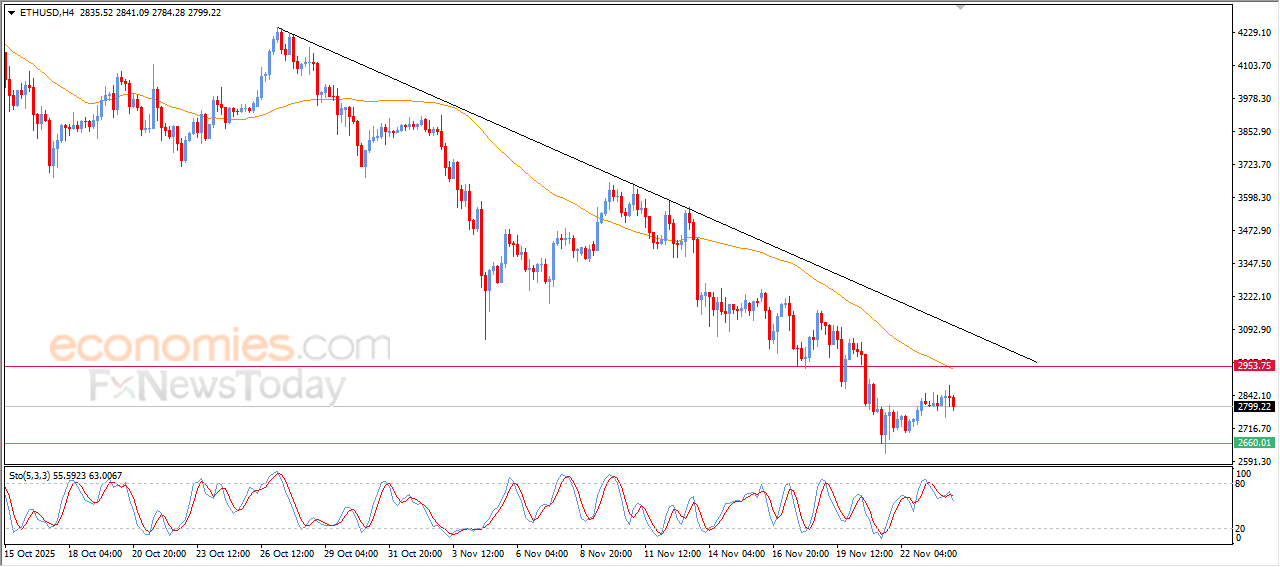
The price of (ETHUSD) declined in its last intraday trading, with the emergence of negative signals after reaching overbought levels, besides the continuation of the negative pressure due to its trading below EMA50, and under the dominance of the main bearish trend on the short-term basis with its trading alongside supportive trend line for this trend.
Forecast update for bitcoin -24-11-2025
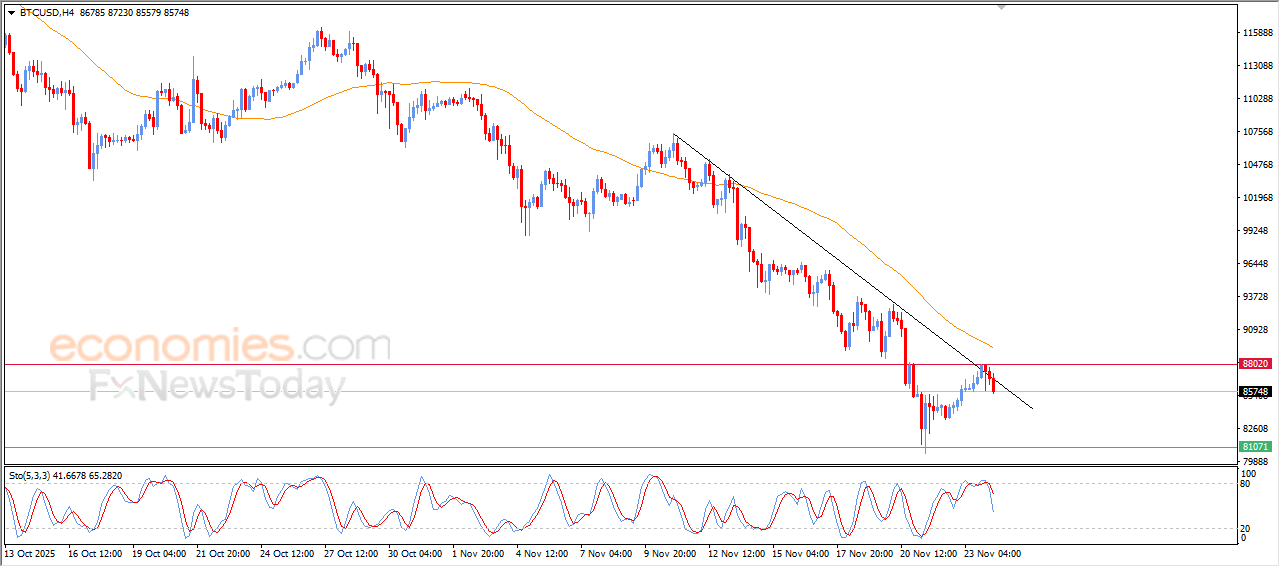
Bitcoin (BTCUSD) prices declined during their last intraday trading, affected by the stability of the resistance at $88,000 level, amid its trading alongside minor bearish trend line on the short-term basis, with the continuation of the dynamic negative pressure that is represented by its trading below EMA50, besides the emergence of the negative signals on the relative strength indicators, after forming negative divergence as it entered overbought levels, exaggeratedly compared to the price move.