The USDJPY price achieves clear gains – Forecast today - 19-09-2024

The USDJPY price surpassed 142.00 level to surpass the key resistance 143.40 by today’s open, noticing that the price attempts to consolidate below this level, accompanied by the RSI loss to the positive momentum, which supports the chances of resuming the expected bearish trend on the intraday and short-term basis, which its targets begin by testing 140.24.
Holding below 143.40 is important to the continuation of the expected decline, as breaching it will lead the price to achieve additional gains and test 145.36 before any new negative attempt.
The expected trading range for today is between 142.30 support and 144.00 resistance
Trend forecast: Bearish
The GBPUSD price hits the target - Forecast today - 19-09-2024

The GBPUSD price succeeded to achieve our waited target at 1.3265$ and reached the thresholds of 1.3300$ barrier, to rebound bearishly and test the EMA50 that forms good support against the price, to resume the positive trades now and attempt to rise again, waiting to surpass the mentioned target to open the way to head towards 1.3325$ as a next positive station.
Therefore, the bullish trend will remain valid for the upcoming period, noting that breaking 1.3124$ will force the price to turn to decline and achieve bearish correction on the intraday basis.
The expected trading range for today is between 1.3120$ support and 1.3280$ resistance.
Trend forecast: Bullish
The EURUSD price shows mixed trades – Forecast today - 19-09-2024

The EURUSD price rose strongly yesterday to approach our waited target at 1.1200$, as it was affected by the Federal Reserve that cut the US dollar interest rate, noticing that the price bounce bearishly to attack 1.1100$ level, as it started today with additional negativity to break this level, but it recovers now and attempts to trade above it again.
Now, we will depend on yesterday’s close above 1.1100$ to keep our bullish overview for the upcoming period, which gets good support by the EMA50, waiting to visit 1.1200$ as a next main station, taking into consideration that holding below 1.1100$ will put the price under new correctional pressure that targets 1.1040$ areas initially.
The expected trading range for today is between 1.1040$ support and 1.1200$ resistance.
Trend forecast: Bullish
Interest rate cuts may help Nasdaq surpass 20,000 points – Will you benefit from this potential shift?

The Nasdaq 100 index, which includes the top 100 non-financial companies listed on the Nasdaq exchange, experienced an exciting year in 2024. The index reached an all-time high on July 10, surpassing the psychological barrier of 20,000 points, before undergoing a short-to-medium-term correction amid profit-taking.
Future Expectations
- With the Federal Reserve nearing the start of a new easing cycle in the United States, it is expected that the correction phase for the Nasdaq index will end soon, and the index will strongly rebound, trading above 20,000 points once again.
- According to most forecasts from major institutions and banks, the Nasdaq 100 is likely to continue hitting new record levels in the final quarter of this year.
Therefore, it is not unlikely that the Nasdaq index will enter a broad upward cycle in the coming period, potentially reaching levels of 22,000 points before the end of this year.
Nasdaq Performance in 2024
- Overall, analysts at major economic institutions and global banks expect the Nasdaq 100 to perform positively in the last quarter of this year, with short-term volatility during the U.S. presidential elections in November.
- Overall, 2024 is filled with challenges and opportunities for the Nasdaq 100, as various economic and geopolitical factors interact to shape its direction.
Despite the challenges, there are optimistic forecasts that innovation and investment in AI technology could support the index, reflecting the state of the U.S. economy and future outlook.
Factors Impacting US Stock Performance
Interest Rate Cuts
Investors worldwide are closely watching the Federal Reserve’s decision on interest rates later today, Wednesday, September 18, amid strong expectations for a 50-basis point rate cut.
This decision is expected to have a positive impact on the performance of U.S. stocks on Wall Street, especially if the rate cut is more aggressive and hints at additional rate cuts before the year ends.
Expected Impact of Rate Cuts
- Economic Growth: Lower interest rates typically encourage investment and consumption, driving the economy forward. This expected growth can boost corporate earnings and, in turn, stock prices.
- Increased Liquidity: Rate cuts create a more liquid monetary environment, making borrowing easier for companies and individuals. This can lead to increased business investments, supporting economic growth.
- Lower Financing Costs: For companies, lower interest rates mean reduced borrowing costs, potentially increasing profitability and attracting investors to their stocks.
- Asset Value Increase: Typically, asset values, including stocks and real estate, rise when interest rates fall. Investors seek higher returns in a low-rate environment, driving them to buy higher-yielding assets.
Overall, the rate cut decision is seen as a positive factor for U.S. stocks in the short and medium term, but long-term effects will depend on economic growth prospects and financial stability.
US Presidential Elections
In 2016, when Donald Trump assumed the U.S. presidency in November, trading volumes on U.S. financial markets soared to historic levels.
Eight years later, the U.S. is witnessing another election cycle where Trump might return to lead the world’s largest economy, and market investors are fully aware of the potential for unexpected outcomes.
According to a report by the Wall Street Journal, in the days leading up to the 2020 presidential election, there was no significant increase in trading volumes compared to the sharp rise following the 2016 election, when futures trading volumes hit a record 44.5 million contracts the day after the election.
Trade policy remains one of the most closely watched issues in the U.S. and abroad this year, with a significant impact on market performance.
A victory for Republican candidate Donald Trump could raise major concerns for global trade, especially with the potential for renewed trade tensions with China.
Conversely, a victory for Democratic candidate Kamala Harris, who does not advocate aggressive trade policies, could significantly reduce the likelihood of trade conflicts with China, unlike the current period under President Joe Biden.
About the Nasdaq 100
The Nasdaq 100 is a stock index composed of 100 of the largest non-financial technology companies listed on the Nasdaq exchange. It is one of the most important and widely followed indices for measuring the performance of the technology sector in the U.S. and globally.
- Nasdaq 100 History: The Nasdaq 100, also known as the "US-Tech 100," was launched in 1985 to track the performance of the top 100 technology companies listed on the Nasdaq.
- How Nasdaq 100 is Calculated: The value of the Nasdaq 100 is calculated using a method known as the "modified market-capitalization weighting."
How Important is Nasdaq 100?
- A Key Technology Index: The Nasdaq 100 is one of the most important indices in the world, used by investors to track the performance of the technology sector in the U.S.
- A Measure of the U.S. Economy: The Nasdaq 100 is often used as a general gauge of the health of the U.S. economy, the world’s largest economy.
- A Benchmark Index: The Nasdaq 100 is used as a benchmark for many investment funds, stock options, and other financial derivatives.
- A Tool for Evaluating Company Performance: The Nasdaq 100 can be used to compare the performance of individual companies to the sector as a whole, helping identify potential investment opportunities.
- Global Influence: Since many of the companies listed in the Nasdaq 100 are multinational corporations, the index’s performance has a global impact, making it a key tool for assessing global risks and opportunities.
What Are the Components of Nasdaq 100?
- Composition: The Nasdaq 100 consists of 100 non-financial companies, which are some of the largest technology companies listed on the Nasdaq.
- Company Selection: Companies are selected for inclusion in the index based on their size, liquidity, and importance to the U.S. economy.
- Periodic Review: The list of companies in the index is reviewed periodically.
Top Companies Currently Listed in the Nasdaq 100
| Company | Symbol |
|---|---|
| Apple | AAPL |
| Microsoft | MSFT |
| NVIDIA | NVDA |
Factors Affecting the Nasdaq 100
- Economic Growth: U.S. economic growth is a key factor influencing the Nasdaq index. When the U.S. economy grows, corporate earnings tend to rise, leading to higher stock prices and an increase in the index’s value.
- Inflation: High inflation can erode corporate profits, which could result in lower stock prices and a decrease in the index’s value.
- Interest Rates: Interest rates impact borrowing costs for companies and individuals. When interest rates rise, companies become less profitable, and consumer spending may decline, which could lead to lower stock prices and a drop in the index’s value.
- Geopolitical Factors: Geopolitical events like wars, tensions, conflicts, and political instability can affect investor confidence and lead to sharp market volatility, impacting the value of the Nasdaq index.
- Company Performance: The performance of companies that make up the Nasdaq 100 is one of the most important factors affecting its value. When these companies report strong earnings, their stock prices tend to rise, driving the index’s value higher.
- Investor Sentiment: Investor sentiment plays a key role in market movements on Wall Street. When investors are optimistic, they are more likely to buy stocks, which could drive stock prices higher and increase the value of the index.
Best Nasdaq Trading Brokers and Platforms 2024
- Pepperstone - Best overall Nasdaq Index trading broker for beginners. Multiple regulated licenses. Minimum deposit: $0. 20% discount on deposit.
- Plus500 - Best licensed broker for investing in Nasdaq Index. Multiple regulated licenses. Minimum deposit: $100.
- XM - Top Nasdaq Index trading platform for educational materials and copy trading. Multiple regulated licenses. Minimum deposit: $5. Periodic competitions and bonuses.

Technical Analysis of Nasdaq (Nasdaq)
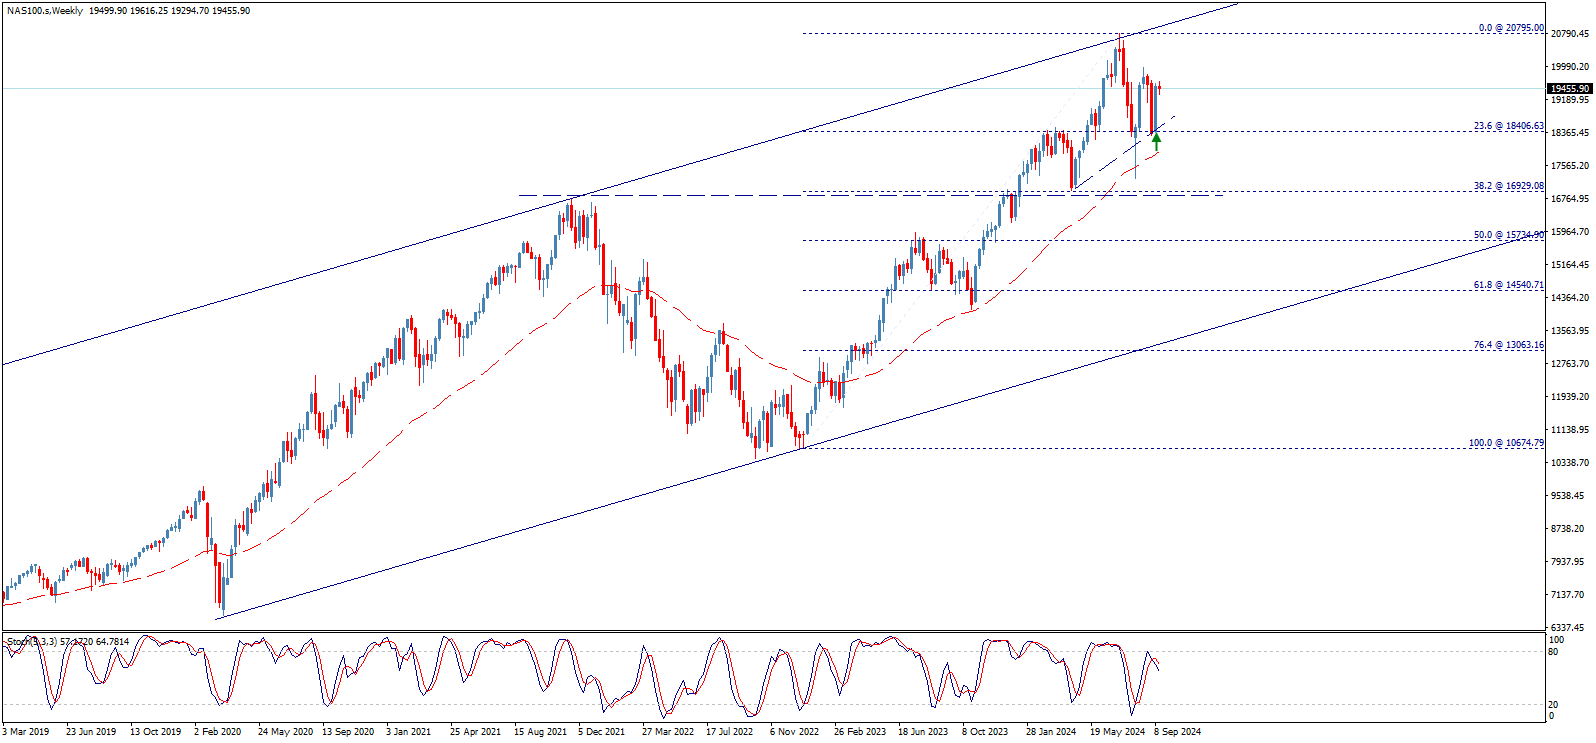
The weekly chart of the Nasdaq index shows that the tech index continued its strong rise, reaching new historical levels at 20,795.00. It rebounded from there, making a downward correction of the upward wave that started from 10,674.80. After approaching the 38.2% Fibonacci retracement level for the mentioned rise, the index resumed its upward trend. The following chart illustrates the technical idea:
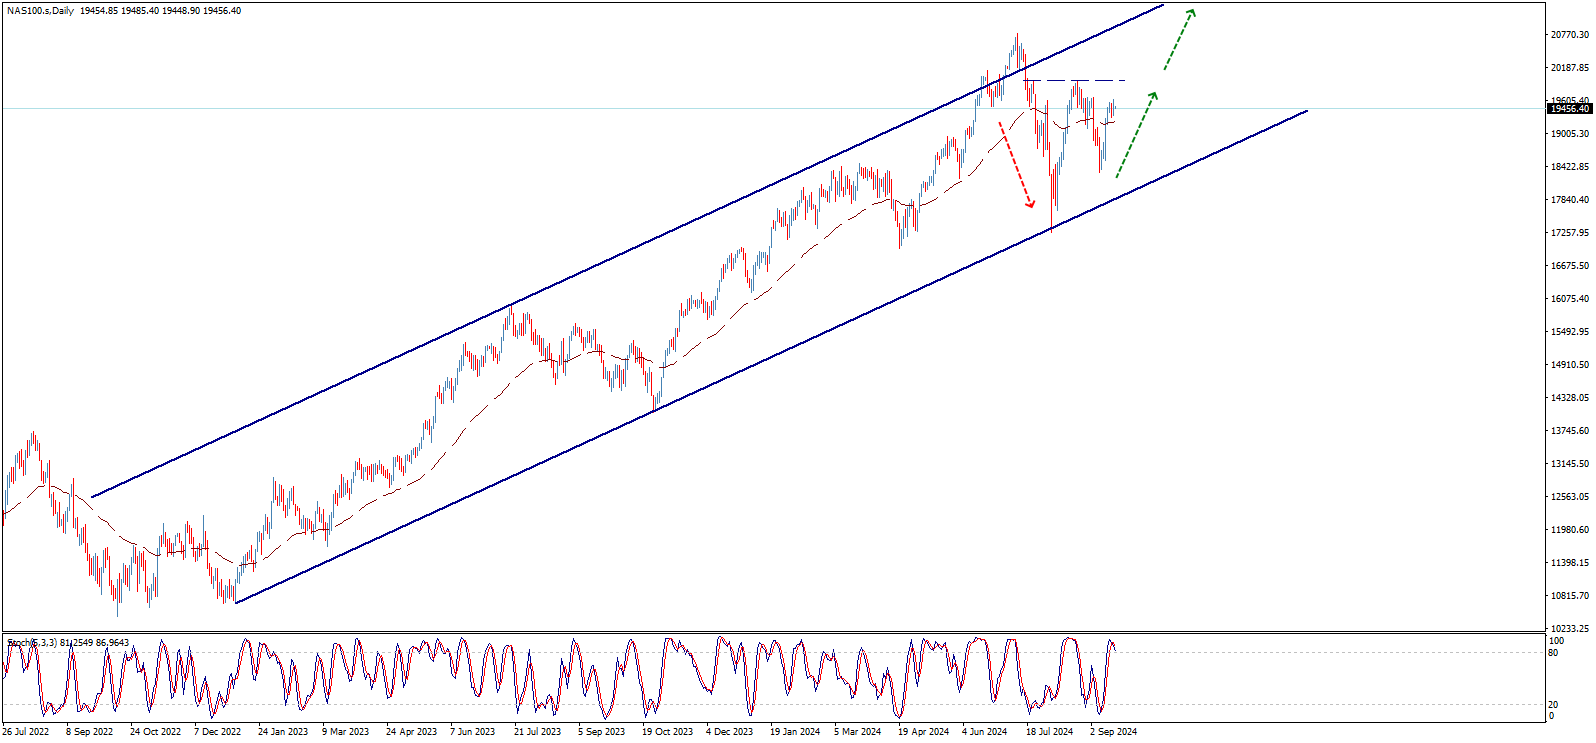
In shorter time frames, we find that the index is moving within an upward channel that carries the latest upward wave. After recently resting on the support of this channel, we expect the index to resume the upward trend, achieving positive targets starting with testing the aforementioned peak, followed by breaking through this level to target levels of 22,000.00, then 22,987.30 in the medium term.
Support and Resistance
- The 50-period exponential moving average provides positive support to the index, supporting the chances of continuing the upward trend.
- The index needs to break a key resistance level located at 19,958.00 to confirm the push for further gains.
- The 19,958.00 level forms the neckline for a double bottom pattern currently forming.
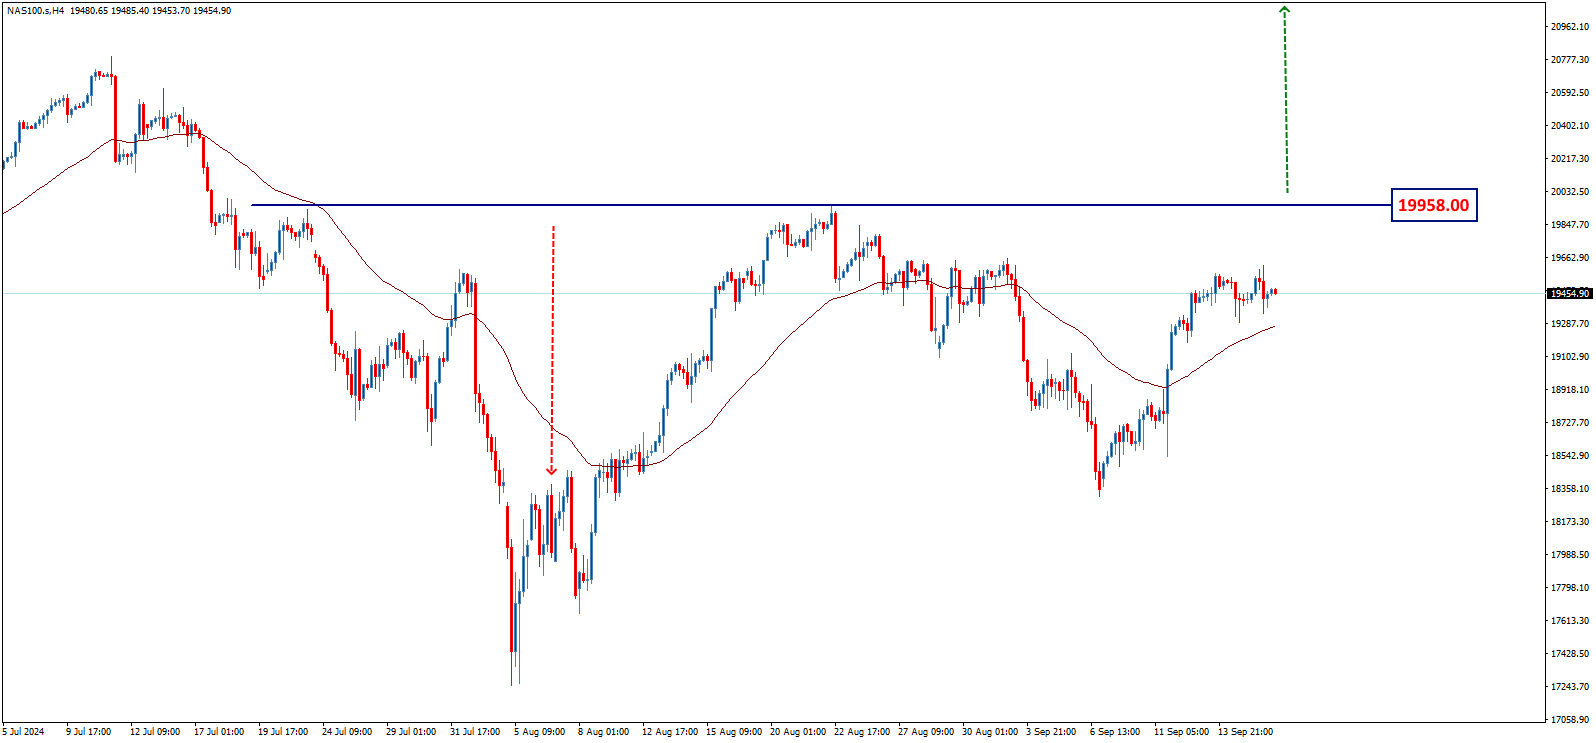
The targets of the mentioned pattern align with the previously mentioned goals, as we expect further rises in the coming period, achieving new historical levels.
Expected Direction
Thus, an upward trend is expected in the short and medium term, possibly preceded by some negative attempts until the index can gain positive momentum that supports the continuation of the main upward trend.
Key Levels
On the other hand, it is important to note that breaking the 18,406.00 and then 17,965.00 levels will halt the upward trend, putting pressure on the price to make an additional downward correction.
- Correction targets start with testing the 16,930.00 area.
- The targets may extend to 15,735.00 before attempting to rise again.
Conclusion: The index remains in an upward trend in the medium and long term, but some support levels must be watched to achieve further gains.