The USDCHF Price is getting ready to attack key resistance- Analysis-18-02-2026
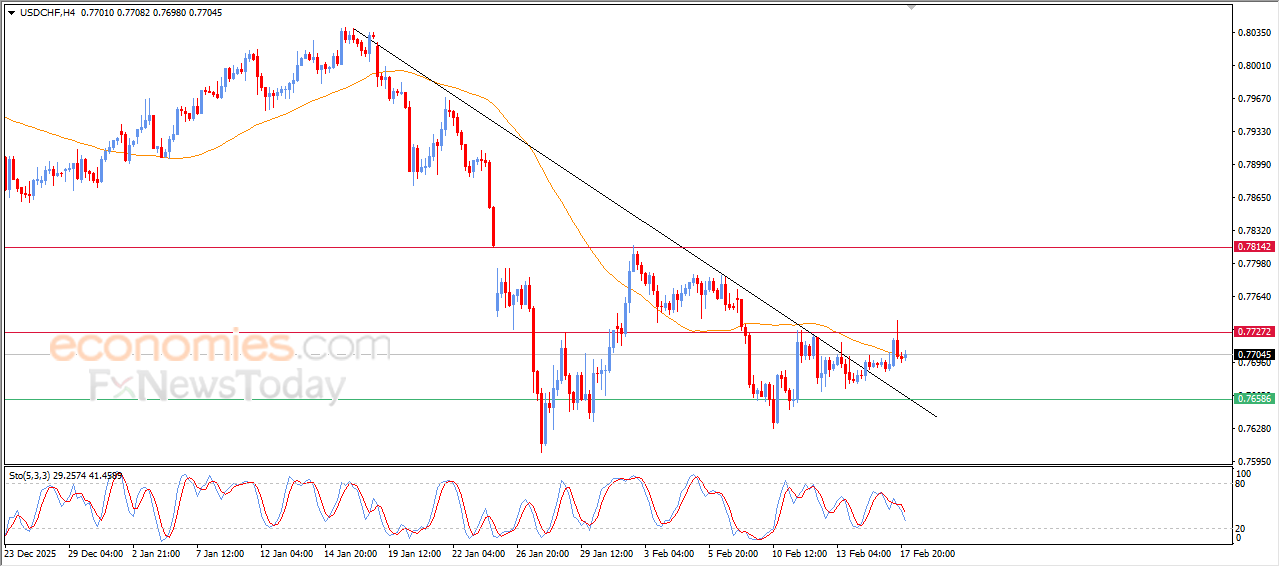
The (USDCHF) price settles on losses in its last intraday trading, with the stability of the key resistance at 0.7725, with the emergence of negative signals from relative strength indicators, reaching EMA50’s support, in attempt to gain bullish momentum that might help it to breach this resistance and detect the upcoming track in the upcoming period, affected by breaching main bearish trend line on short-term basis.
NZDUSD is breaking bullish trend line-Analysis-18-02-2026
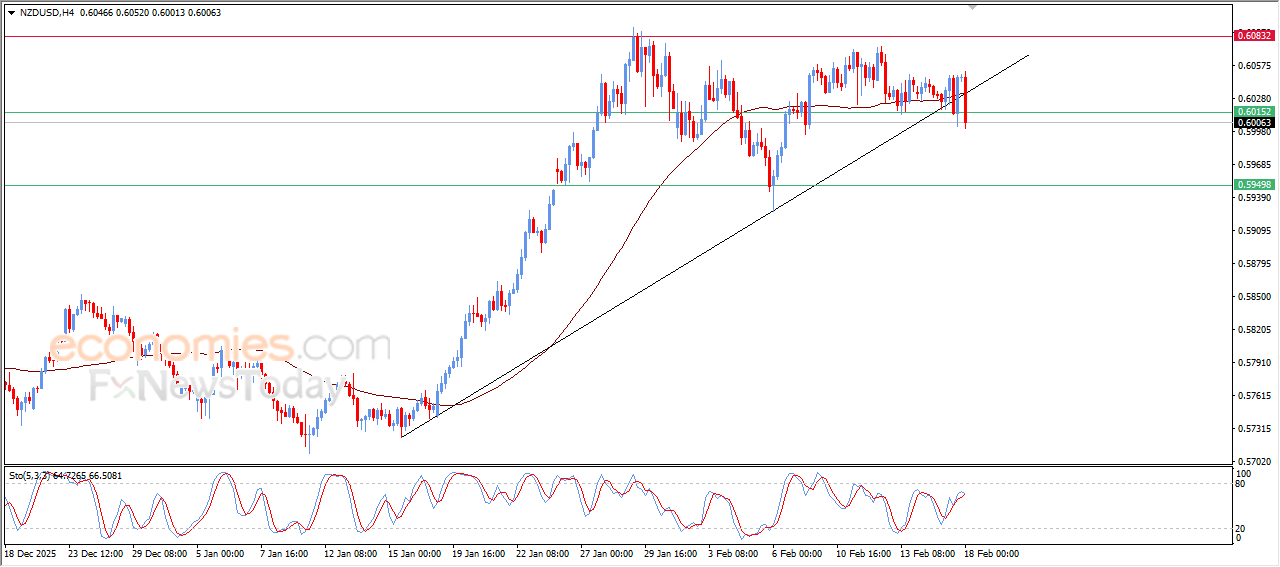
The (NZDUSD) price slipped lower in its last intraday trading, in fluctuating move that confirms breaking main bullish trend line on short-term basis, accompanied by surpassing EMA50’s support, which confirms its momentum to extend its corrective losses on near-term basis, especially with the emergence of negative overlapping signals from relative strength indicators after reaching overbought levels.
The AUDUSD price is gathering its positive strength- Analysis-18-02-2026
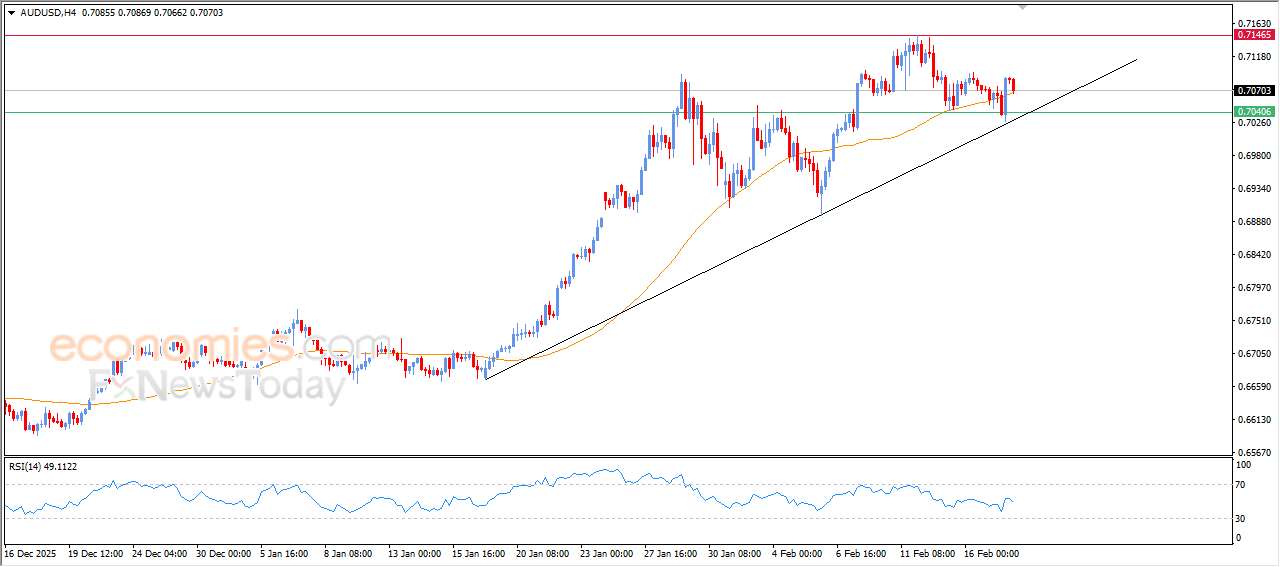
The (AUDUSD) price declined in its last intraday trading, with the emergence of the negative signals from relative strength indicators, in attempt to gain bullish momentum that might help it to resume its strong gains on near-term basis, leaning on EMA50’s support, reinforcing the stability and dominance of the main bullish trend on short-term basis, especially with its trading alongside supportive trend line for this path.
The USDCAD prices begin to rise again- Analysis-18-02-2026
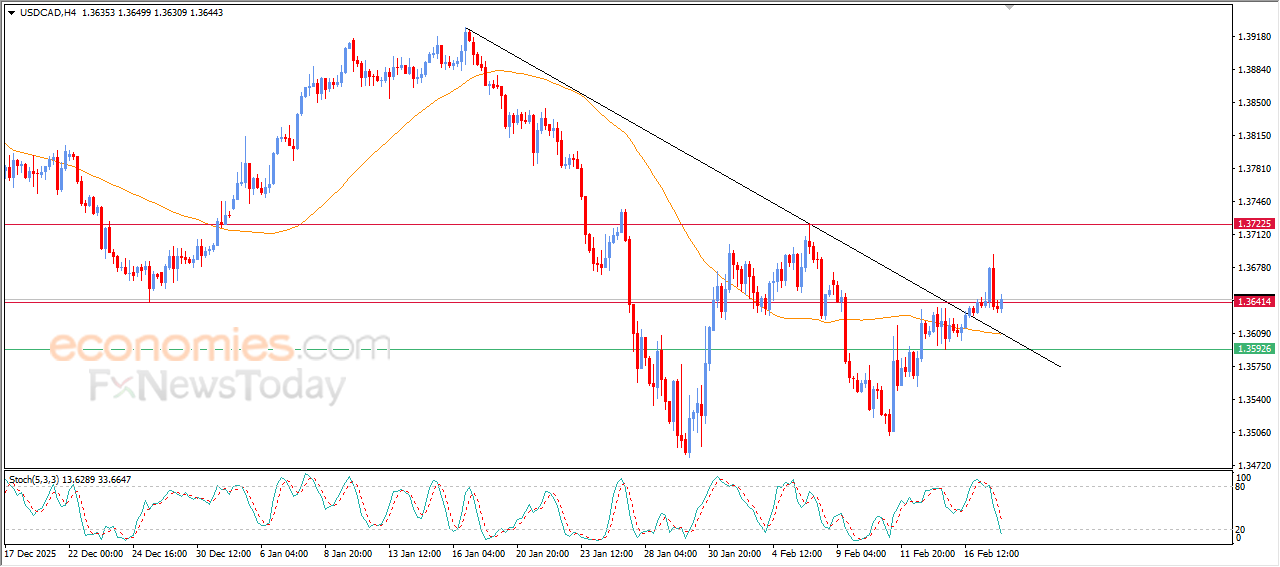
The (USDCAD) price rose slightly in fluctuating moves on its last intraday levels, affected by breaching main bearish trend line on short-term basis, taking advantage of the dynamic support that is represented by its trading above EMA50, reinforcing the chances of moving higher on near-term basis, with the relative strength indicators reaching exaggerated oversold levels compared to the price move, indicating a beginning of forming positive divergence.