The USDCHF price is breaking the neckline of head and shoulders pattern- Analysis-27-11-2025
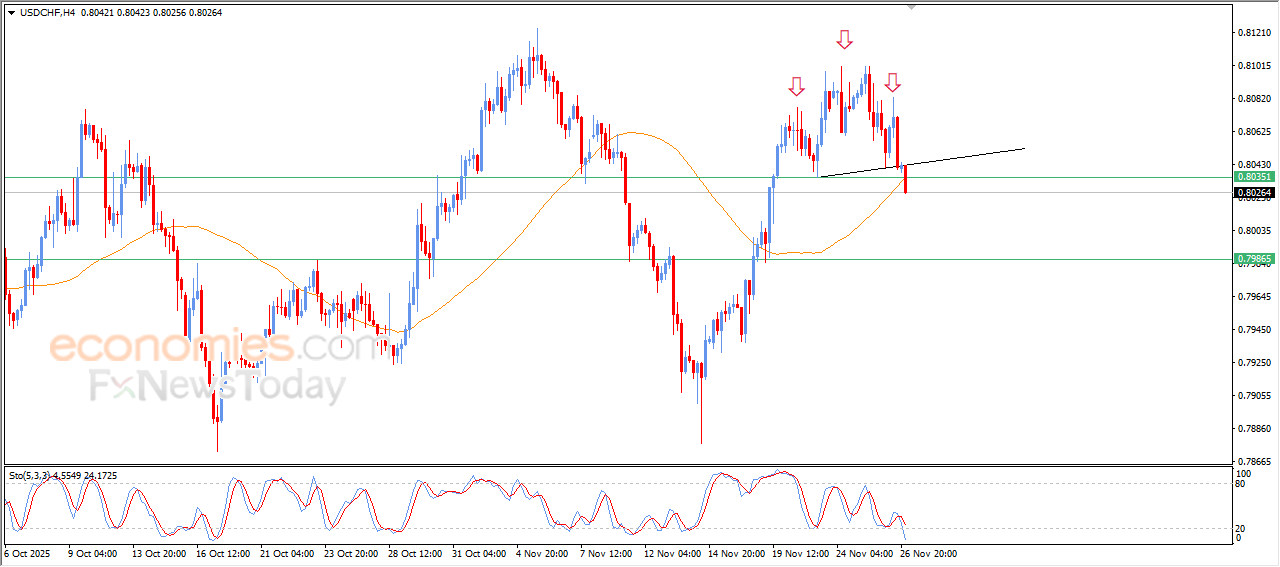
The (USDCHF) price slipped lower in its last intraday trading, breaking negative technical formation on the short-term basis (the head and shoulders pattern), accompanied by surpassing the support of its EMA50, intensifying the importance of this break to detect the upcoming trend on the near sessions, especially with the emergence of the negative signals on the relative strength indicators, despite reaching oversold levels, intensifying the negative pressures.
NZDUSD keeps rising-Analysis-27-11-2025
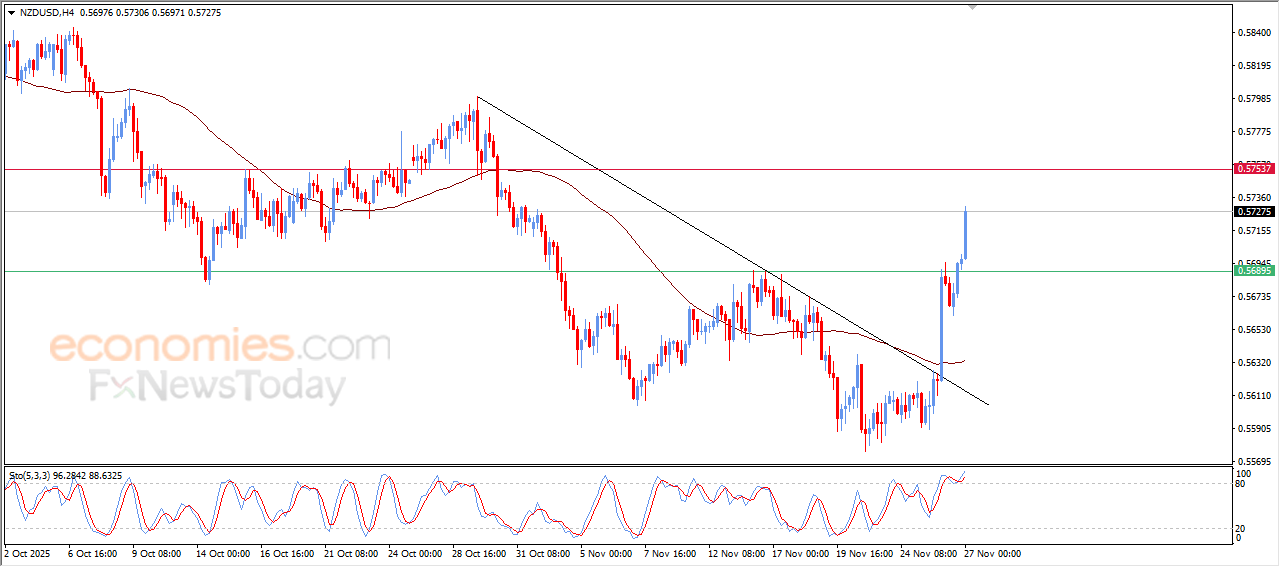
The (NZDUSD) price surged high in its last intraday trading, taking advantage of breaching 0.5690 resistance level previously, amid the dominance of bullish corrective wave, indicating the strength of this track and its stability on the near-term basis, especially with the continuation of the positive pressure due to its trading above EMA50, with the emergence of positive signals on the relative strength indicators, despite its stability in overbought levels.
The AUDUSD price achieves our suggested target- Analysis-27-11-2025
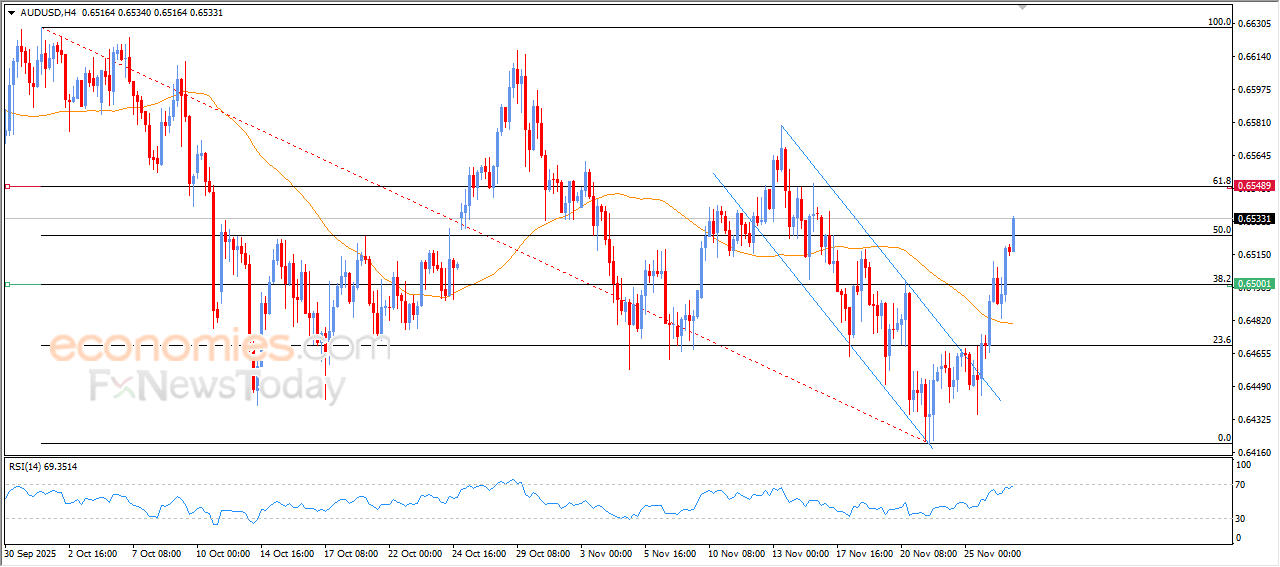
The (AUDUSD) price kept rising in its last intraday trading, to breach 0.6525 resistance, this resistance represents %50 Fibonacci corrective levels of the last bearish wave on the short-term basis( from 0.6628 to 0.2422), to surpass our expected target in our previous analysis at 0.6515, amid the continuation of the dynamic support that is represented by its trading above EMA50, with the emergence of positive signals on the relative strength indicators, despite reaching overbought levels.
The USDCAD price is deepening its losses- Analysis-27-11-2025
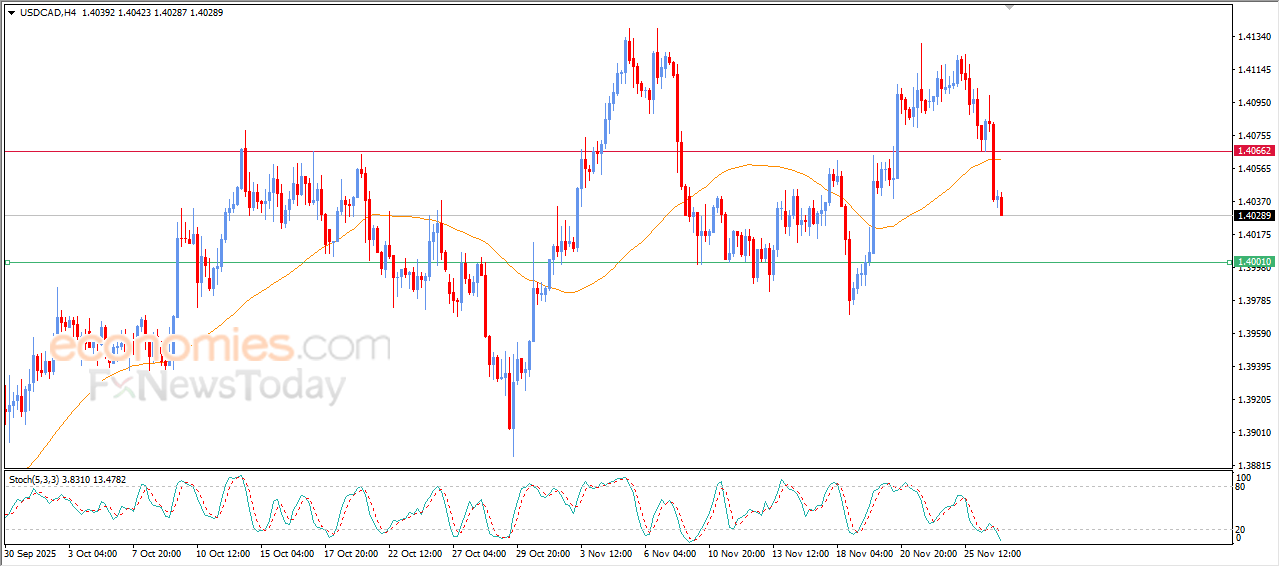
The (USDCAD) price continued it decline sharply in its last intraday trading, amid the dominance of bearish corrective wave that helped it surpass the support of its EMA50, putting it under intensive negative pressure and reduced the chances of full recovery on the near-term basis, especially with the continuation of the negative signals on the relative strength indicators, despite reaching oversold levels.