The USDCHF Price is breaking bullish corrective trend line- Analysis-23-02-2026
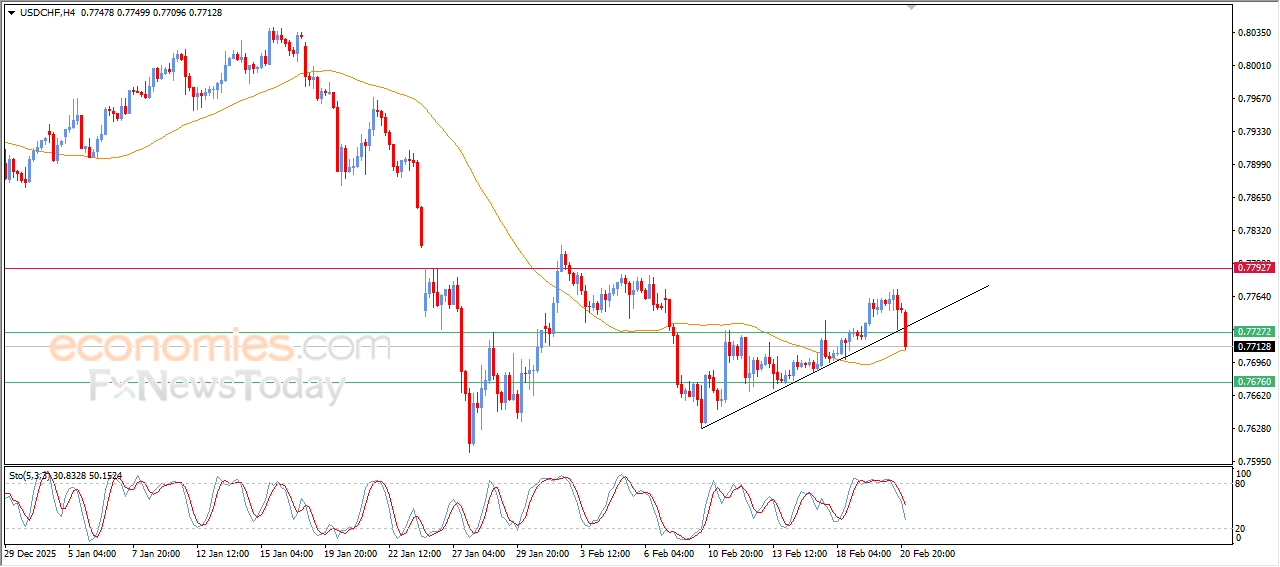
The (USDCHF) price slipped lower in its last intraday trading, amid the emergence of negative signals from relative strength indicators, after reaching overbought levels, to break bullish corrective trend line on short-term basis, reinforcing the bearish scenario, to lean on EMA50’s support, if it surpasses it, the price momentum to deepen its losses will be formed in the upcoming period.
NZDUSD is witnessing cautious gains-Analysis-23-02-2026
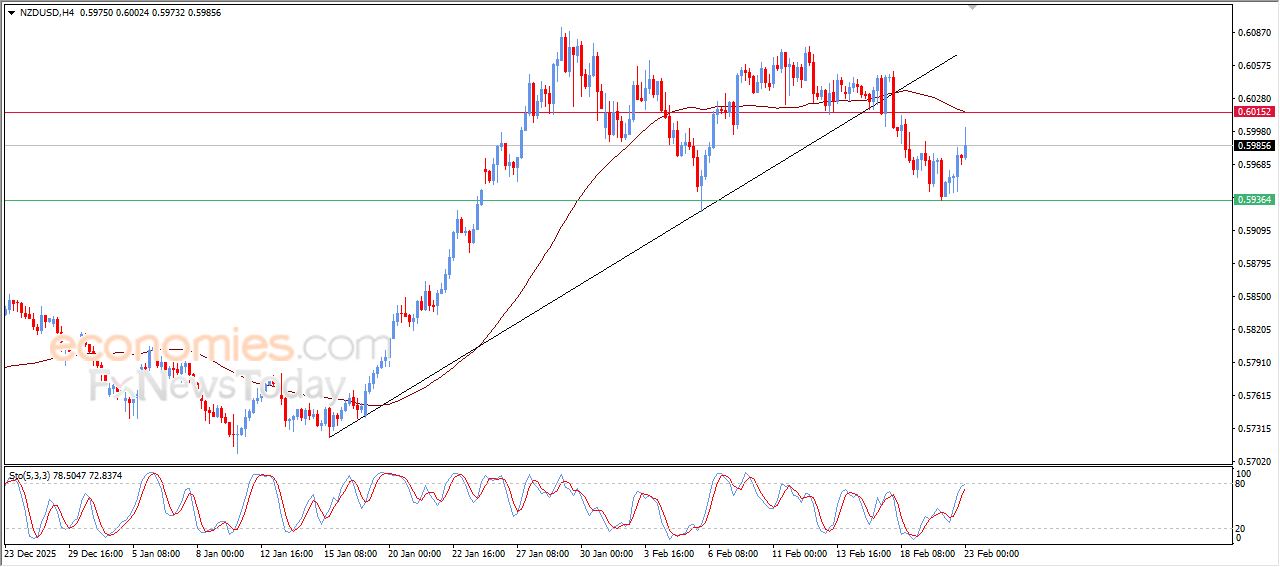
The (NZDUSD) price rose in its last intraday trading, amid the emergence of positive signals from relative strength indicators, reaching exaggerated overbought levels compared to the price move, indicating a quick decline in the bullish momentum strength, especially with the continuation of the negative pressure due to its trading below EMA50, reducing the chances of its full recovery, besides breaking main bullish trend line on the short-term basis.
The AUDUSD price is attempting to get rid of its negative pressure- Analysis-23-02-2026
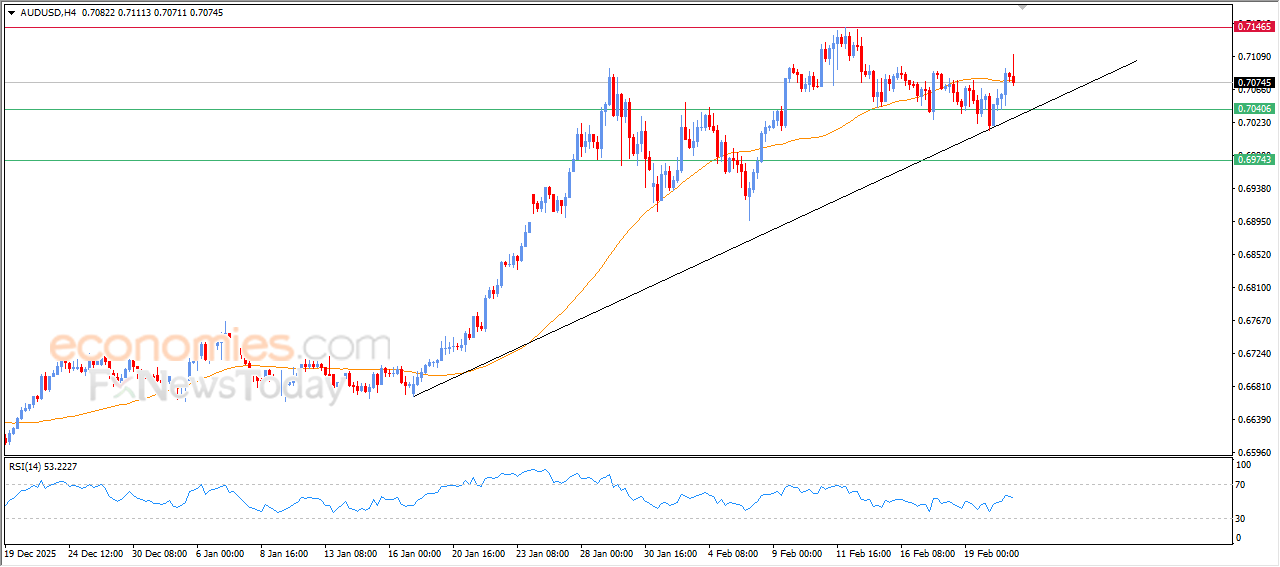
The (AUDUSD) price witnessed fluctuating trading on its last intraday levels, attempting to get rid of the negative pressure of EMA50, announcing its recovery to target new resistance levels on the near-term basis, amid the dominance of the main bullish trend on short-term basis, with the emergence of positive signals from relative strength indicators.
The USDCAD price breaks the support level of negative technical pattern- Analysis-23-02-2026
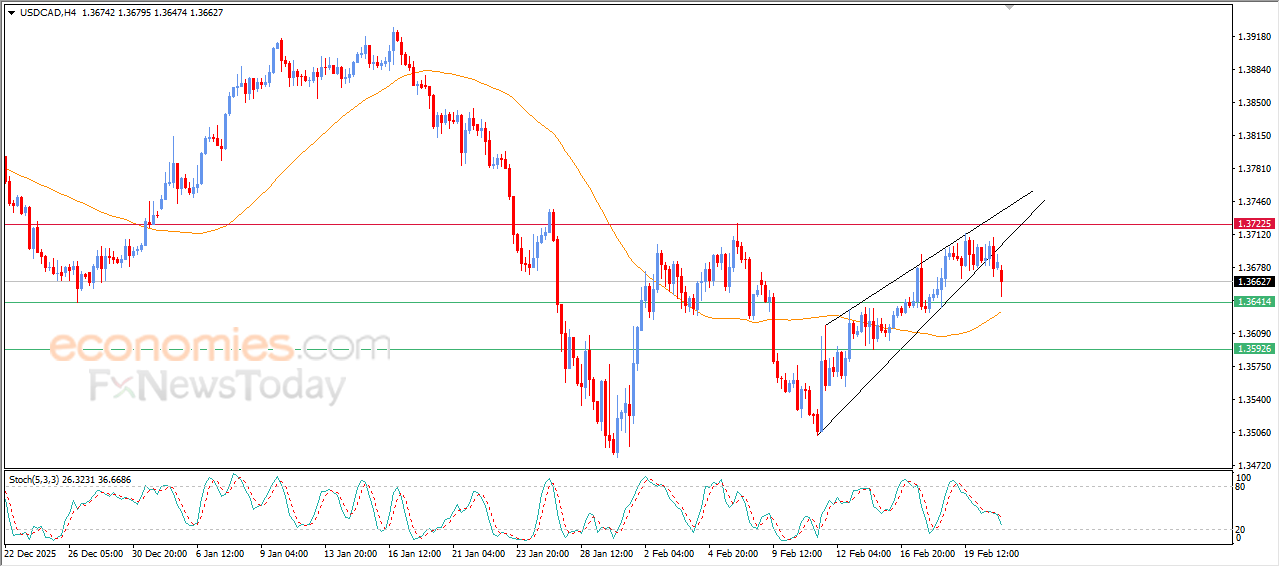
The (USDCAD) price declined in its last intraday trading, amid the emergence of negative signals from relative strength indicators, after reaching overbought levels, to break the support level of short-term negative technical formation, which is represented by the rising wedge pattern, on the other hand, the dynamic support that is represented by the trading above EMA50 represents a key support against extending the losses in the upcoming period.