USDCAD declines affected by a negative technical formation -Analysis-14-05-2025
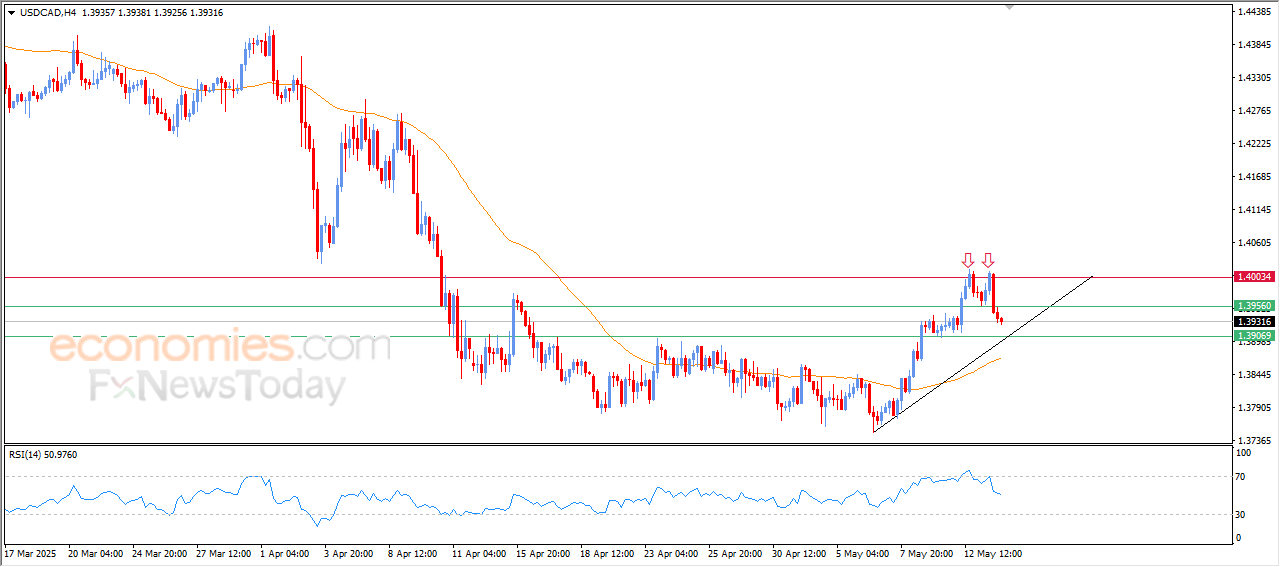
The USDCAD price declined in its recent intraday trading, with the emergence of the negative signals on the (RSI), affected by a negative technical formation that was completed in the end of the current bullish correctional wave – the double top pattern.
This comes amid the continuation of its trading alongside bullish correctional bias on the short-term basis, with the continuation of the positive pressure due to its trading above EMA50.
AUDUSD gets ready to attack critical resistance -Analysis-14-05-2025
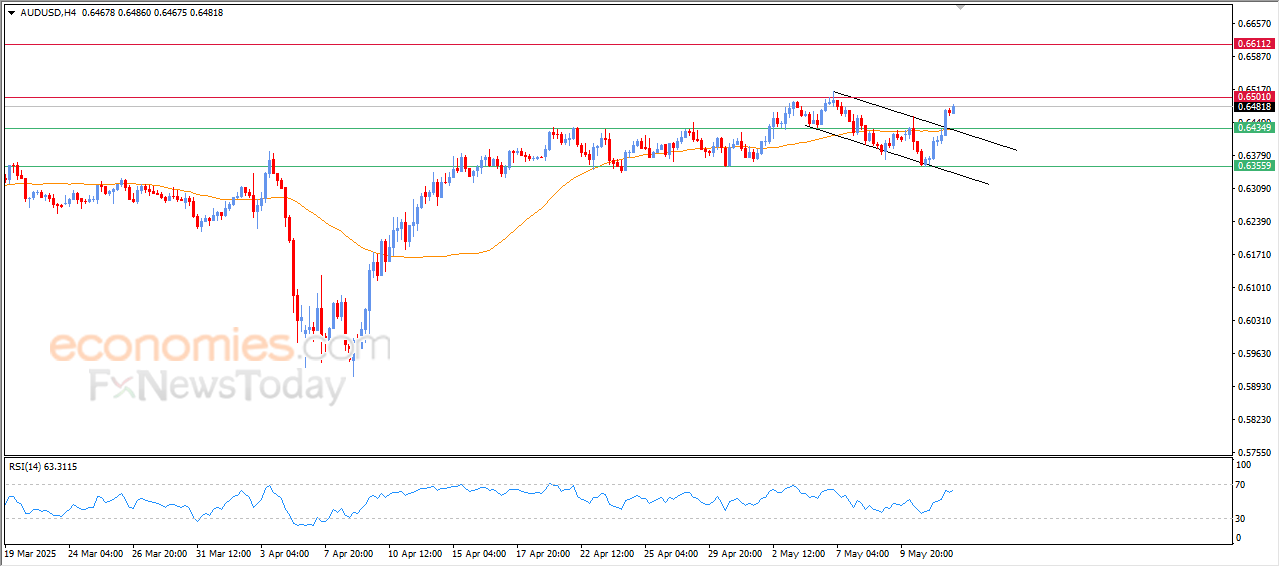
The NZDUSD price rose in its recent intraday trading, and succeeded to exit a bearish correctional channel’s range that was limiting its previous trading on the short-term basis, surpassing the resistance of its EMA50, increasing the positive pressures on its upcoming trading, with the emergence of the positive signals on the (RSI), preparing to attack the key resistance at 0.6500.
MoreNZDUSD attempts to get rid of its negative pressure -Analysis-14-05-2025
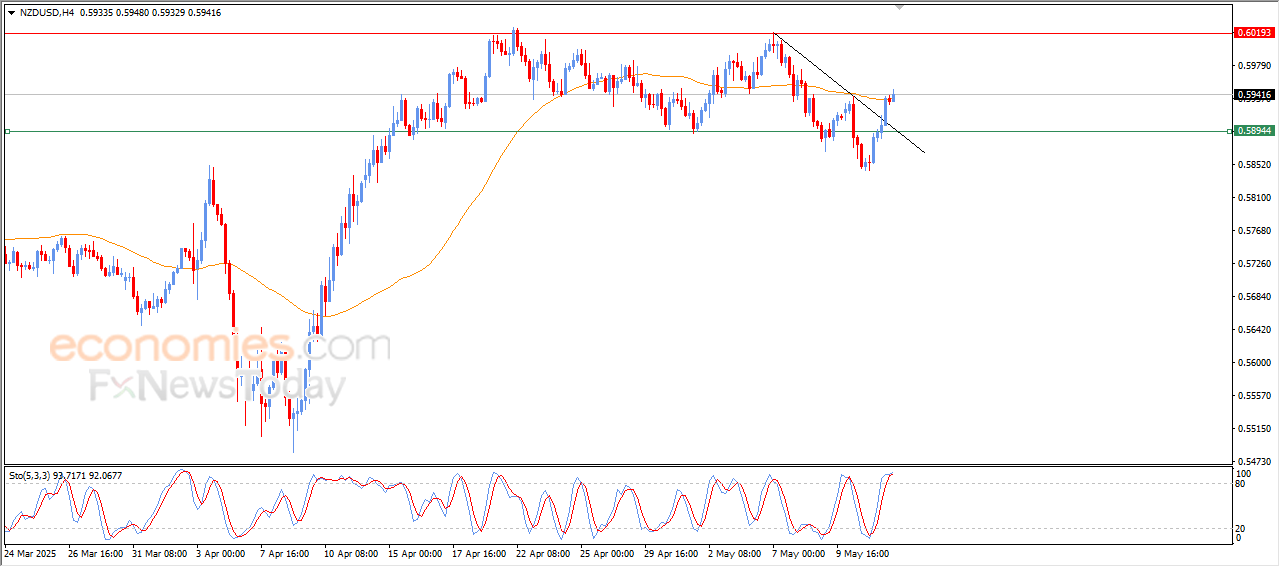
The NZDUSD price rose in its recent intraday trading, affected by breaching a bearish correctional trend line on the short-term basis, supported by the emergence of the positive signals on the (RSI), to notice reaching overbought levels, with the beginning of negative overlapping signals appearance, which might decrease the gains temporarily, as it needs to offload this overbought condition, especially that the pair is attempting to get rid of the negative pressure of the EMA50.
MoreUSDCHF declines alongside a bullish correctional line -Analysis-14-05-2025
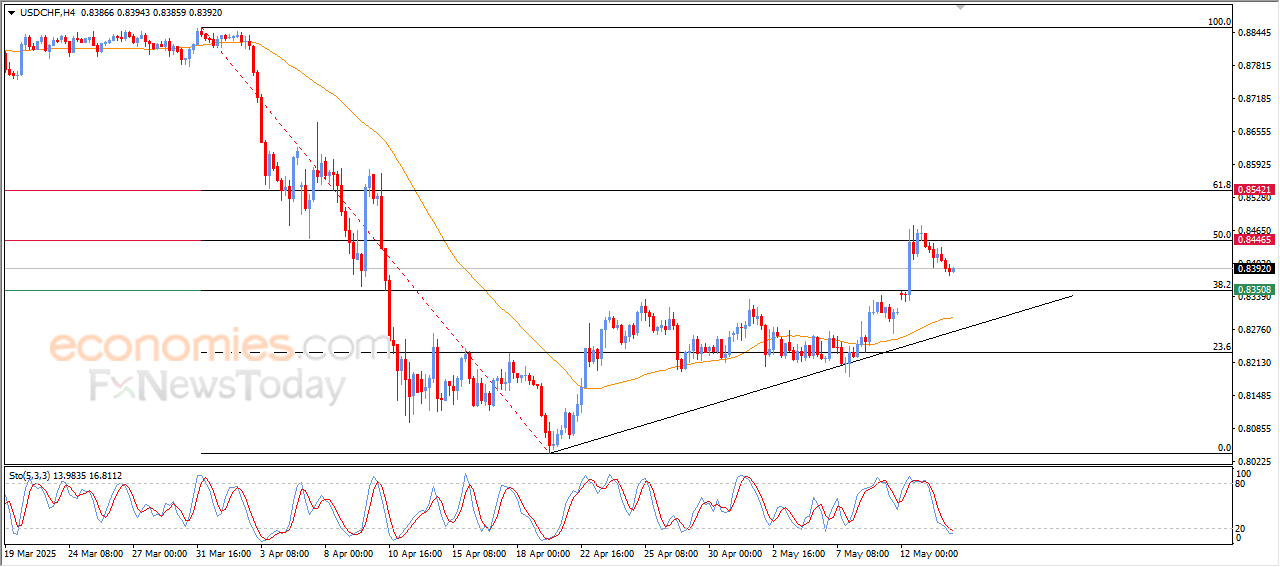
The USDCHF price declined in its recent intraday trading, attempting to look for a rising bottom to take it as a base to gain the required positive momentum to recover, amid its stability above the support of 0.8350, which represents 38.2% Fibonacci correction level for the last bearish wave on the short-term basis (from 0.8854 to 0.8039)
More