


 |
The USDCAD price attacks a corrective bearish trend line - Analysis-29-04-2026
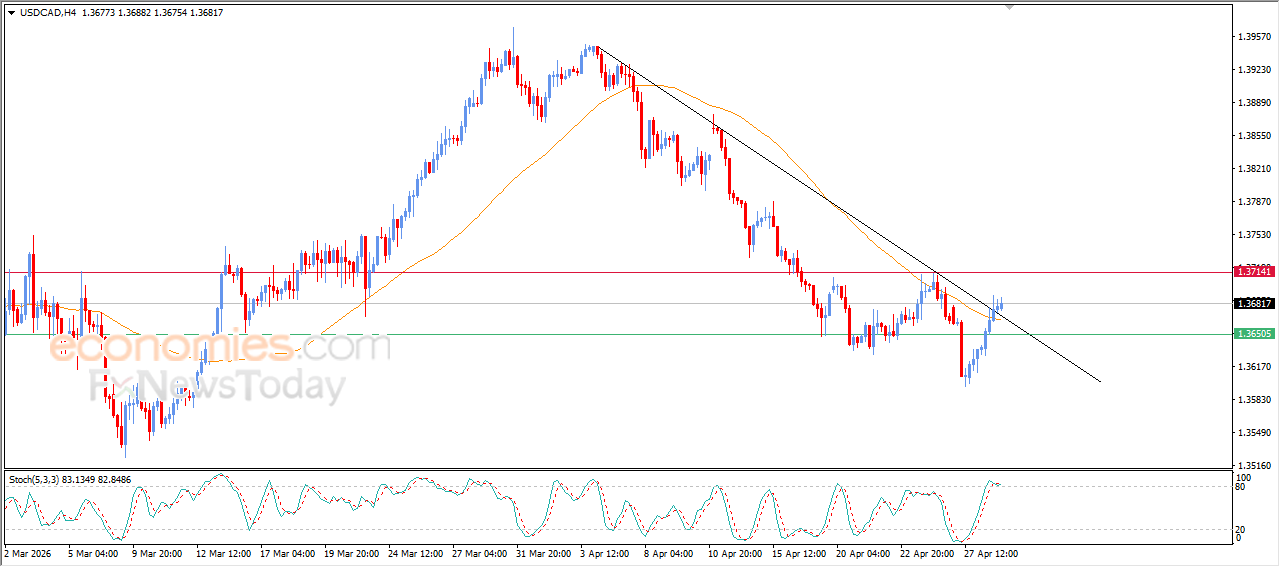
The USDCAD pair extended its gains in recent intraday trading, breaking above its EMA50, surpassing the negative pressure. The pair is now attempting to challenge a short-term corrective bearish trend line.
On the other hand, a negative crossover has started to appear on the relative strength indicators after reaching exaggerated overbought levels compared to the pair’s movement. This suggests the formation of a potential bearish divergence, which could expose the pair to temporary pullback in the near term.
Thanks for your feedback.
The USDJPY gathers positive momentum -Analysis-29-04-2026
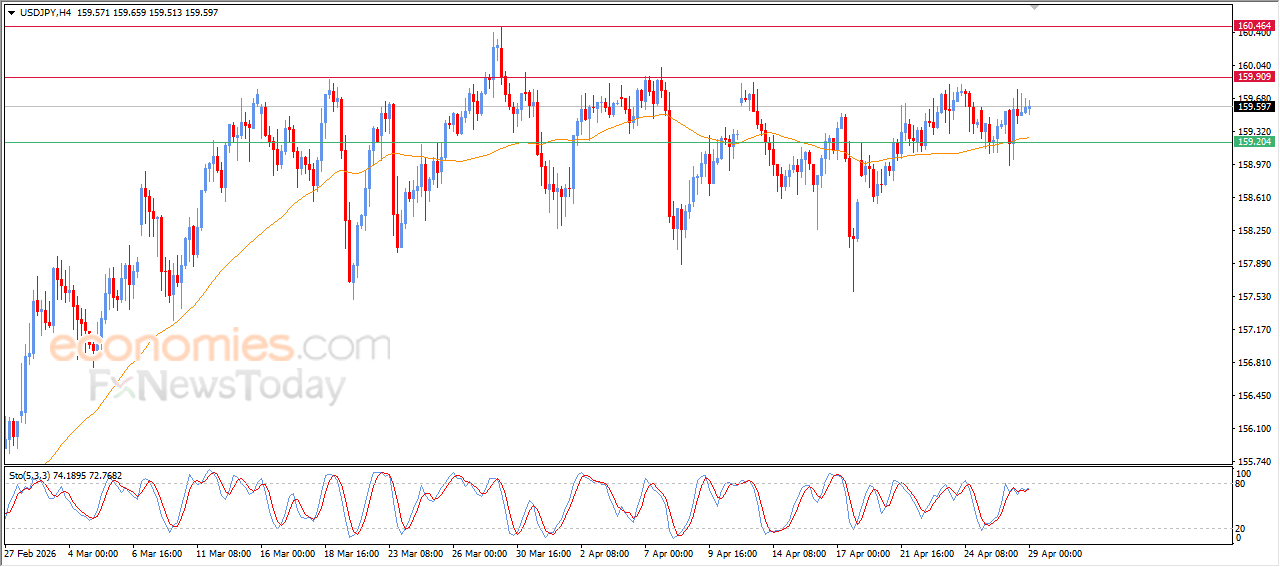
The USDJPY pair witnessed fluctuating trading on its recent intraday levels, as it attempts to build positive momentum that could support a recovery and renewed upside. This comes amid continued dynamic support from trading above its EMA50, which strengthens the likelihood of further gains, especially with the dominance of a short-term bullish trend. Additionally, positive signals emerge from the relative strength indicators, despite remaining in overbought territory.
MoreGBPUSD price attempts to get rid of negative pressure - Analysis- 29-04-2026
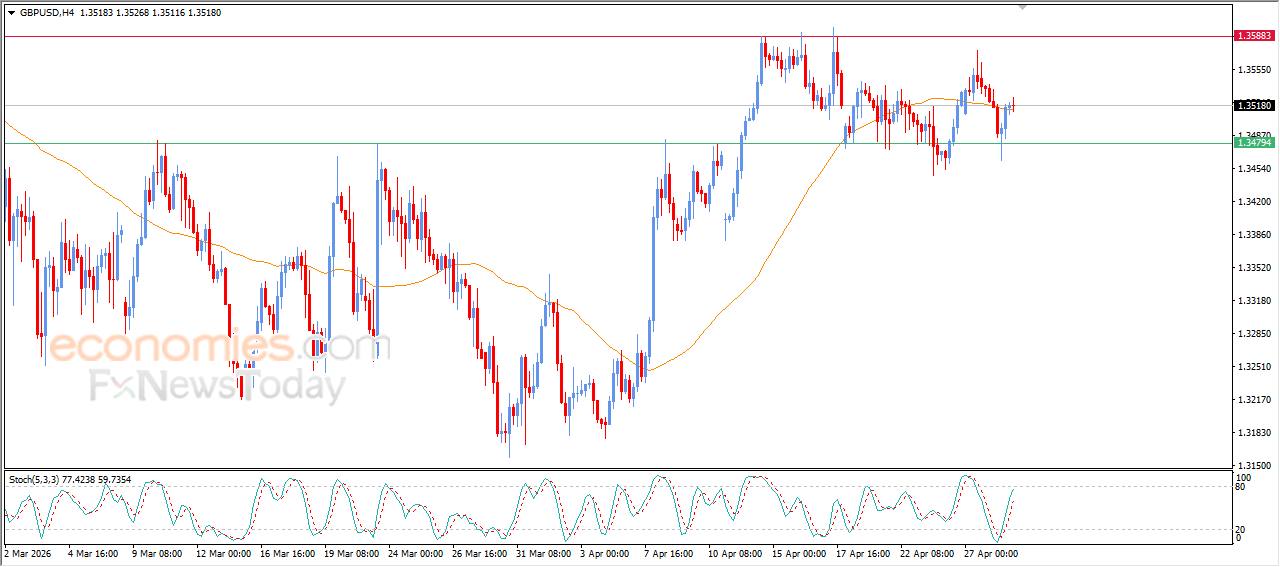
The GBPUSD pair is maintaining the gains achieved in its recent intraday trading, following its rebound from the key support level at 1.3480, gaining positive momentum that helped the pair post those gains, supported by emerging positive signals from the relative strength indicators after reaching heavily oversold levels, attempting to get rid of the negative pressure of the EMA50, which could signal a full recovery, especially as the main short-term trend remains bullish.
MoreBitcoin (BTCUSD) prepares to break its current support - Analysis-29-04-2026
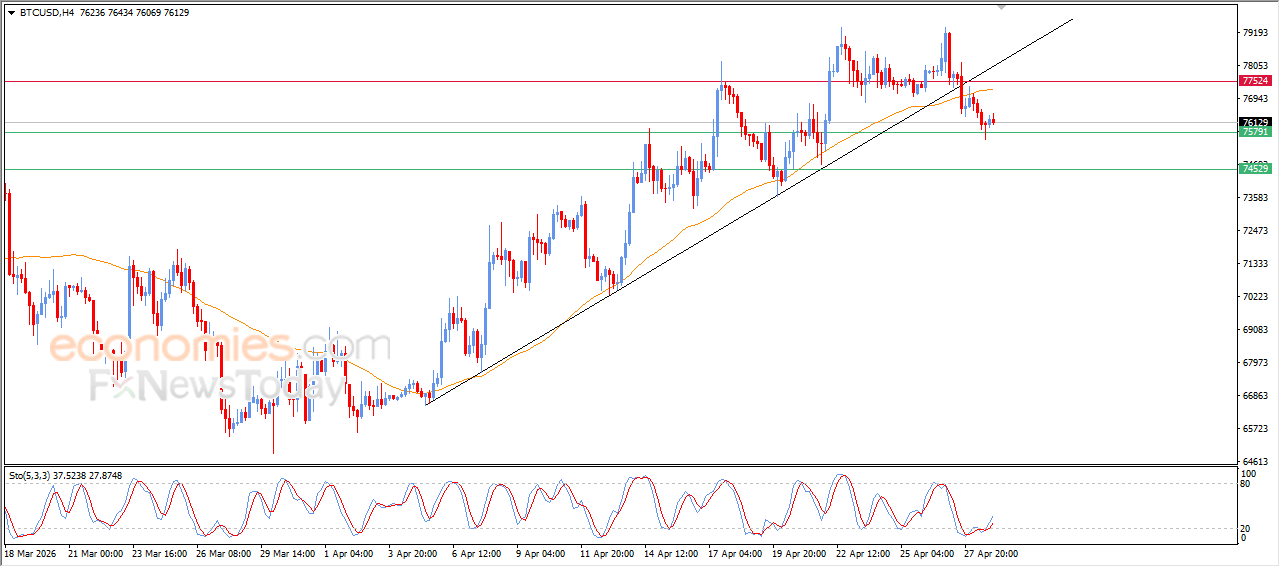
Bitcoin (BTCUSD) declined during its recent intraday trading, approaching a potential break of the current support level at $75,500. To indicate increasing selling pressure and continued short-term weakness, especially after the price was previously affected by breaking a major bullish trend line.
More