The USDCAD breaks a minor bullish trend line -Analysis-14-08-2025
AI Summary
- USDCAD price declined due to negative pressure below EMA50 and breaking minor bullish trend line
- Sellers strengthened, bearish scenario likely to continue with RSI showing negative signals
- BestTradingSignal.com offers high-accuracy trading signals for US Stock, Crypto, Forex, and VIP markets via Telegram subscriptions
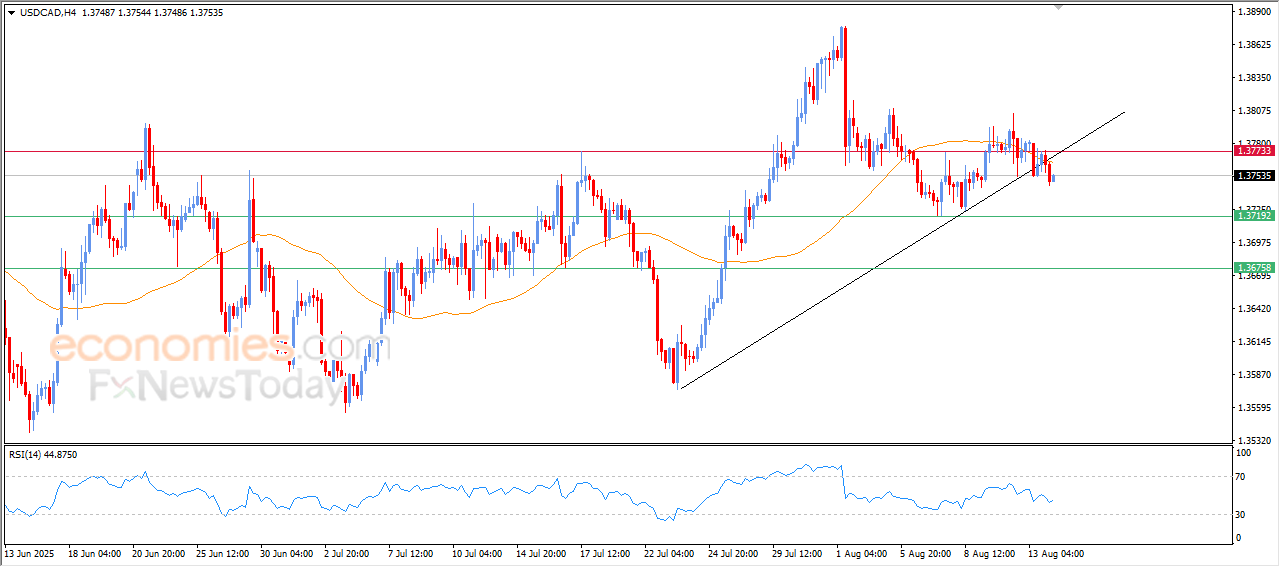
The (USDCAD) price declined in its last intraday trading, due to the negative pressure that comes from its stability below EMA50, breaking the minor bullish trend line on the short-term basis, this technical break reinforces the strength of the sellers and supports the continuation of the bearish scenario, accompanied by the emergence of the negative signals on the (RSI),adding extra pressure on the pair and opens the way for testing lower support levels in the upcoming period.
BestTradingSignal.com – Professional Trading Signals
Get high-accuracy trading signals delivered directly to your Telegram. Subscribe to specialized packages tailored for the world’s top markets:
US Stock Signals from €44/month
Subscribe via TelegramCrypto Signals from €49/month
Subscribe via TelegramForex Signals from €49/month
Subscribe via TelegramVIP Signals (Gold, Oil, Forex, Bitcoin, Ethereum, Indices) from €179/month
Subscribe via TelegramFull performance report available here:
The USDJPY exhausted its positive opportunities -Analysis-14-08-2025
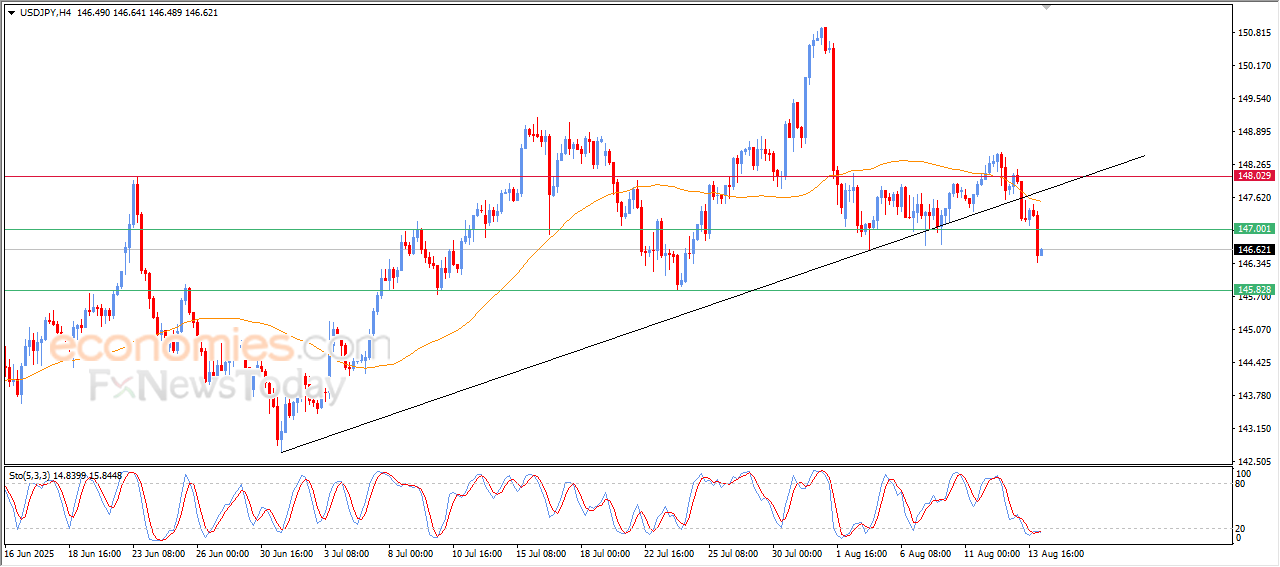
The (USDJPY) price witnessed sharp losses in its last intraday trading, affected by breaking a main bullish trend previously, with the continuation of the negative pressure that comes from its trading below EMA50, to break the key support at 147.00. on the other hand, we notice the emergence of positive overlapping signals on the (RSI), after reaching oversold levels, which provides an opportunity for the price to take a break from those consecutive losses temporarily.
BestTradingSignal.com – Professional Trading Signals
Get high-accuracy trading signals delivered directly to your Telegram. Subscribe to specialized packages tailored for the world’s top markets:
US Stock Signals from €44/month
Subscribe via TelegramCrypto Signals from €49/month
Subscribe via TelegramForex Signals from €49/month
Subscribe via TelegramVIP Signals (Gold, Oil, Forex, Bitcoin, Ethereum, Indices) from €179/month
Subscribe via TelegramFull performance report available here:
The GBPUSD attacks its current resistance -Analysis-14-08-2025
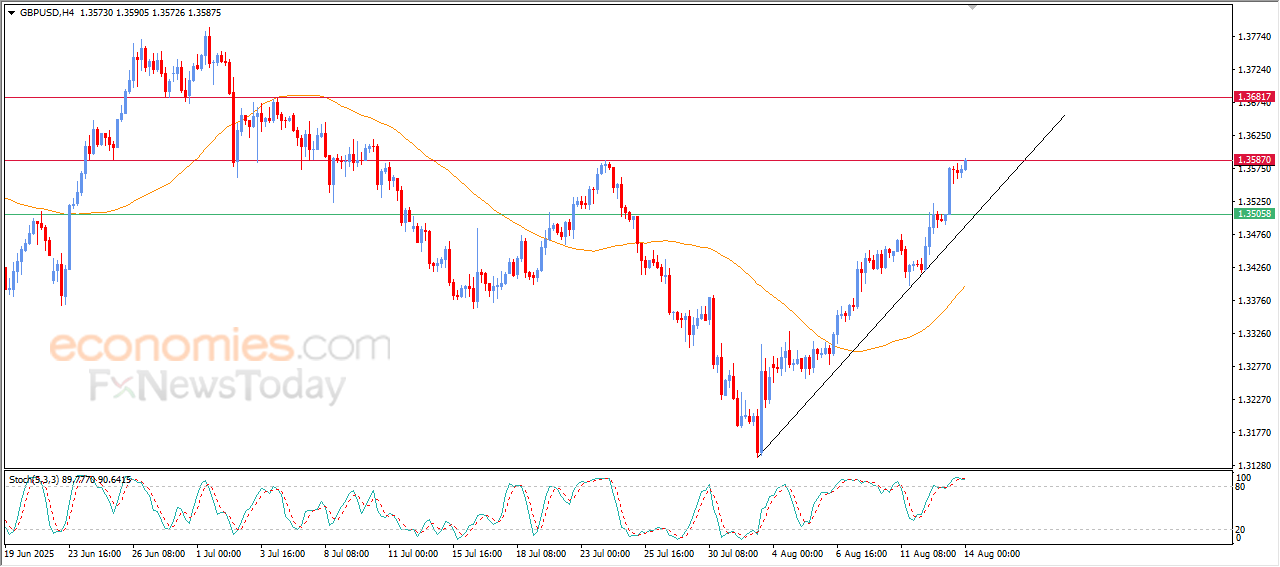
The (GBPUSD) price rose in its last intraday trading, attacking the key resistance level at 1.3590, supported by its continuous trading above EMA50, and under the dominance of bullish correctional wave on the short-term basis, and its trading alongside a supportive line for the bullish track, on the other hand, we notice the reach of the (RSI) indicators to overbought levels, with the emergence of negative overlapping signals, which might reduce the upcoming gains temporarily.
BestTradingSignal.com – Professional Trading Signals
Get high-accuracy trading signals delivered directly to your Telegram. Subscribe to specialized packages tailored for the world’s top markets:
US Stock Signals from €44/month
Subscribe via TelegramCrypto Signals from €49/month
Subscribe via TelegramForex Signals from €49/month
Subscribe via TelegramVIP Signals (Gold, Oil, Forex, Bitcoin, Ethereum, Indices) from €179/month
Subscribe via TelegramFull performance report available here:
Bitcoin (BTCUSD) record new historical highs -Analysis-14-08-2025
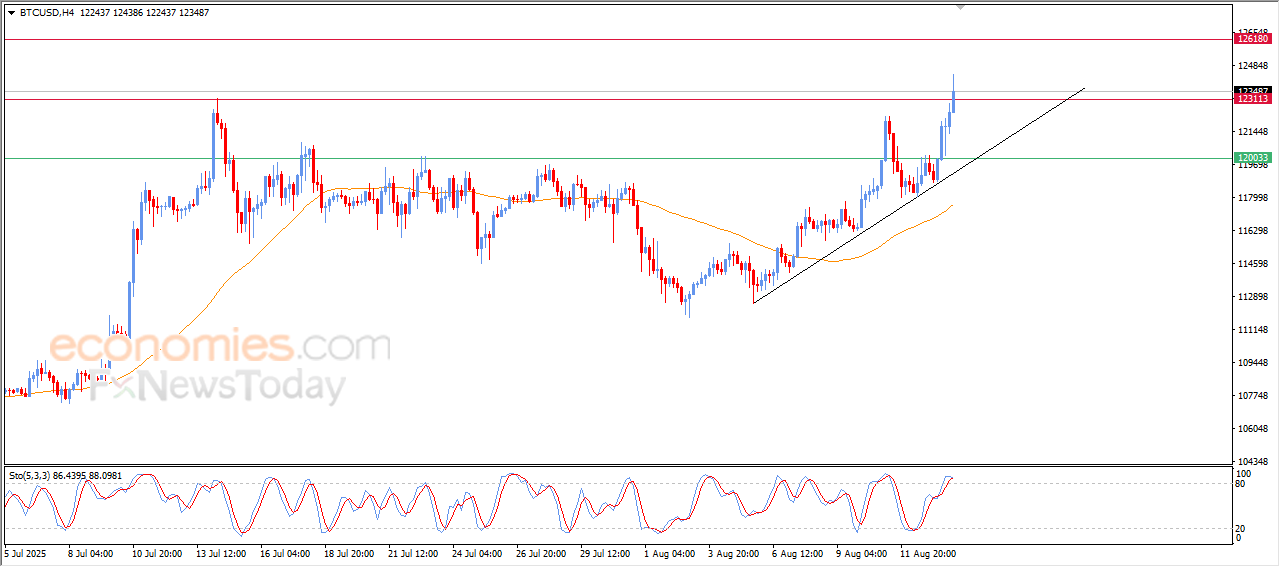
The price of Bitcoin (BTCUSD) soared high in its last intraday trading, to breach the historical resistance level at $123,000, recording breaking prices, this rise came amid the dominance of the main bullish trend, with the trading alongside a minor supportive line on the short-term basis, and the continuation of the trading above EMA50.
The (RSI) supported the bullish track, despite reaching sharp overbought levels, indicating the strength of the current momentum and bitcoin’s ability to resume the rise, and there is a possibility to target new historical levels if it kept its strong technical support.
BestTradingSignal.com – Professional Trading Signals
Get high-accuracy trading signals delivered directly to your Telegram. Subscribe to specialized packages tailored for the world’s top markets:
US Stock Signals from €44/month
Subscribe via TelegramCrypto Signals from €49/month
Subscribe via TelegramForex Signals from €49/month
Subscribe via TelegramVIP Signals (Gold, Oil, Forex, Bitcoin, Ethereum, Indices) from €179/month
Subscribe via TelegramFull performance report available here: