NZDUSD price jumps higher driven by a positive pattern - Analysis-08-04-2026
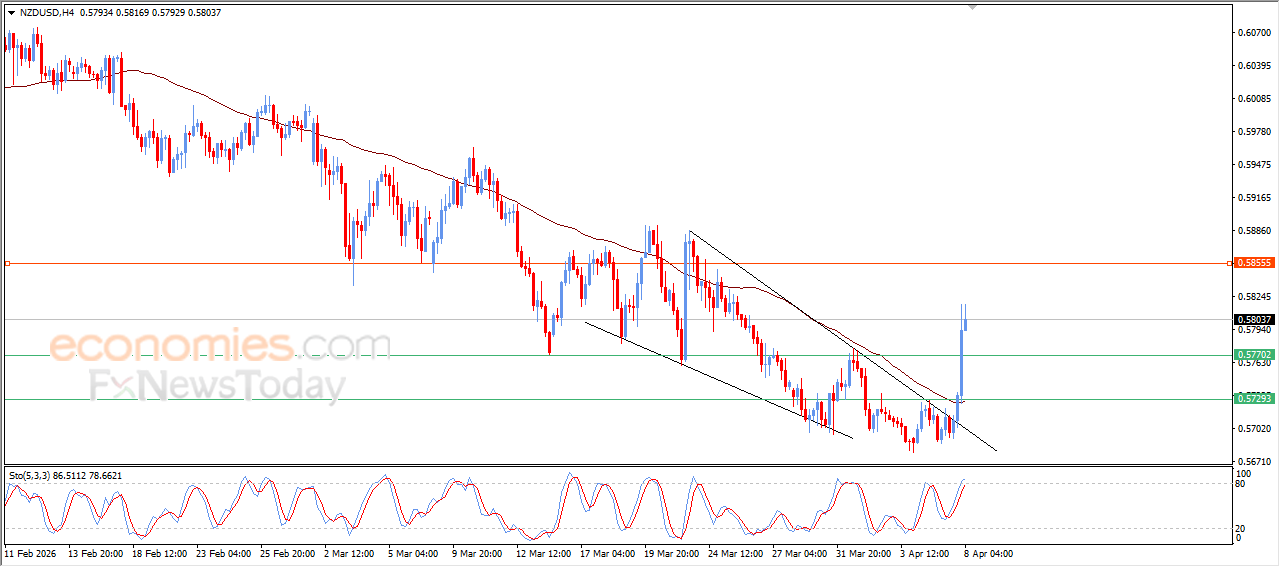
The (NZDUSD) rose strongly during recent intraday trading, driven by a positive technical pattern formed at the end of the main short-term downtrend, specifically a falling wedge pattern. The pair managed to break above EMA50, freeing it from negative pressure and signaling the start of a corrective upward wave in the near term.
In addition, positive signals continue to emerge from the relative strength indicators, supporting further extension of the pair’s gains.
The AUDUSD soars high - Analysis-08-04-2026
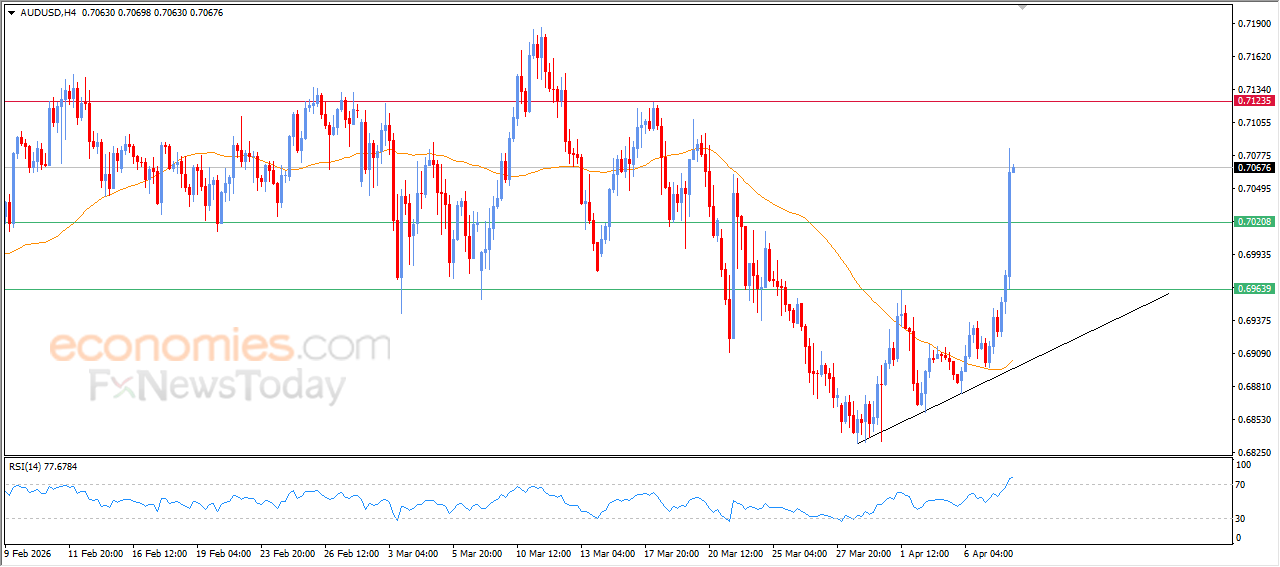
The (AUDUSD) witnessed a sharp rise during recent intraday trading, as the corrective upward trend continues to dominate the pair’s movement in the short term. This comes as the pair benefits from positive dynamic support, represented by trading above EMA50, alongside positive signals from the relative strength indicators, despite reaching heavily overbought levels, indicating strong bullish momentum surrounding the pair.
The USDCAD price breaks support of a negative pattern - Analysis-08-04-2026
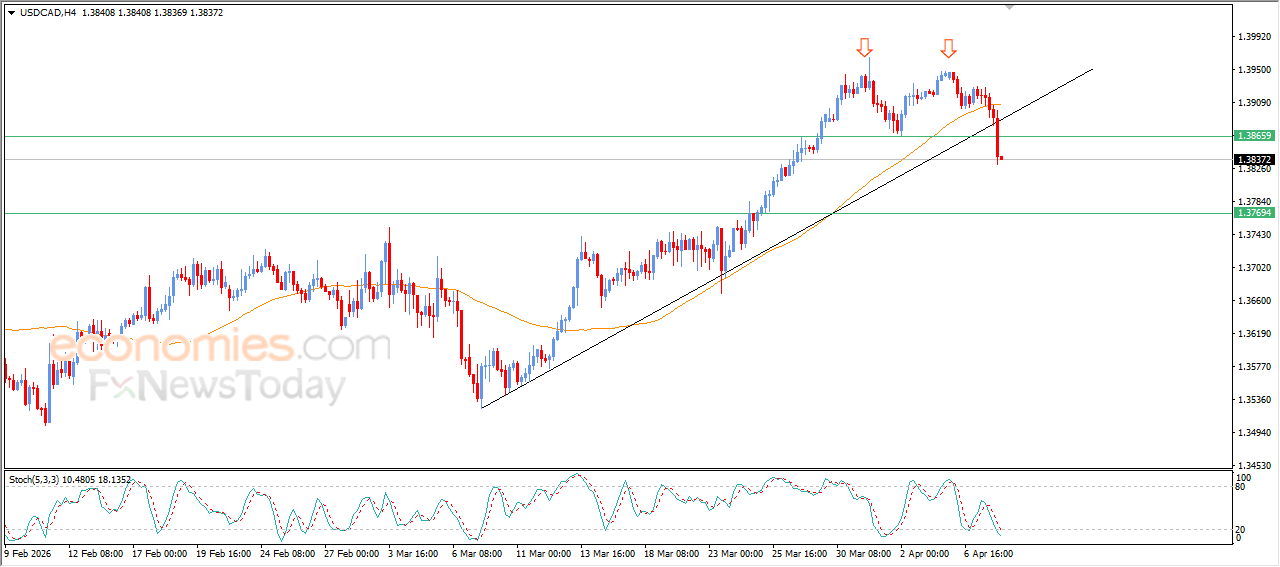
The (USDCAD) declined sharply during recent intraday trading, breaking all nearby support levels. First: breaking below EMA50, followed by breaking a main short-term bullish trendline, which intensified the negative pressure surrounding the pair.
Eventually, the pair broke the key support level at 1.3865. This level represented the neckline of a previously formed negative technical pattern (a double top). In the background, negative signals continue to emerge from the relative strength indicators, despite reaching heavily oversold levels.
The USDJPY price shows a shift in trend -Analysis-08-04-2026
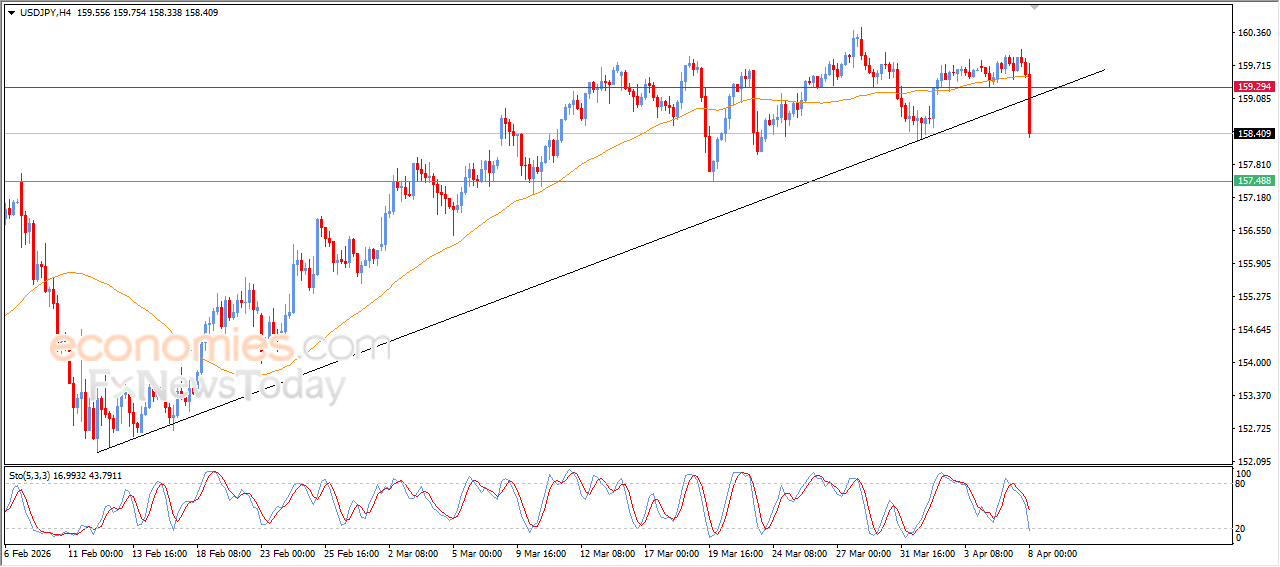
(USDJPY) experienced a sharp decline during recent intraday trading, with the pair breaking below EMA50. This exposed it to increased negative pressure, which intensified further after the pair broke a major short-term upward trendline.
This move signals the beginning of a corrective downward trend in the near term, especially as it coincides with negative signals from the relative strength indicators after reaching heavily overbought levels.