GBPUSD price struggles to overcome negative pressure - Analysis- 27-04-2026
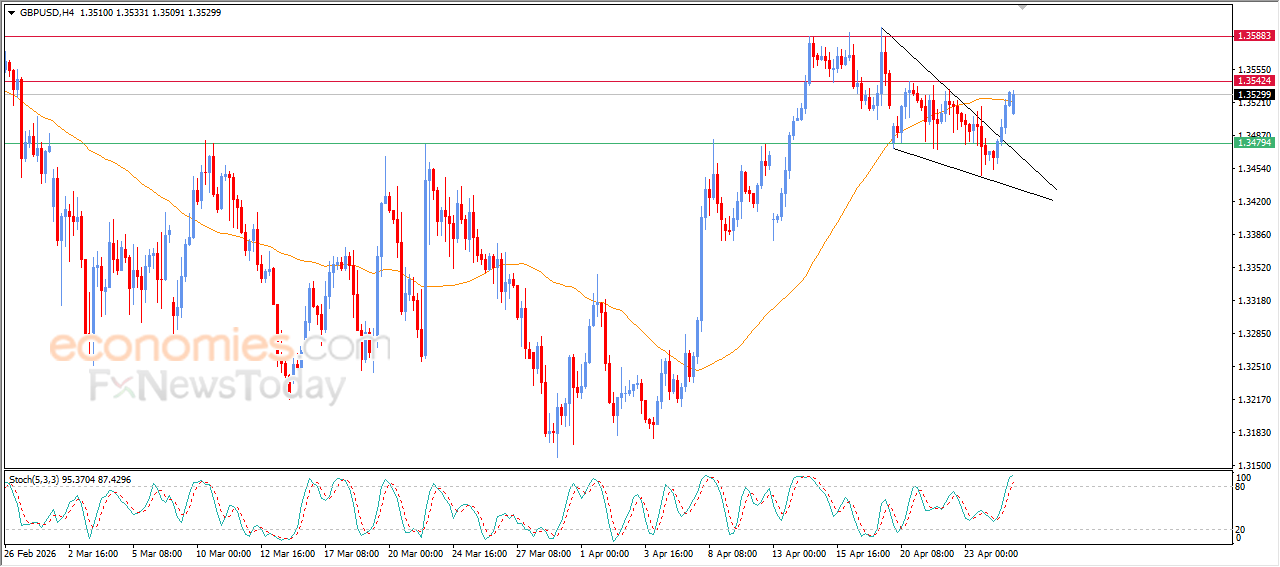
The GBPUSD pair extended its gains during recent intraday trading, supported by breaching the upper boundary of a negative technical formation that developed during a short-term corrective wave, specifically a falling wedge pattern, supported by positive signals from relative strength indicators. However, these indicators have reached heavily overbought levels, which may limit further gains in the near term and could lead to sideways movement or even a temporary decline in search of a higher low, reinforced by facing resistance at EMA50, which increases the pressure.
Bitcoin (BTCUSD) reaches our target - Analysis-27-04-2026
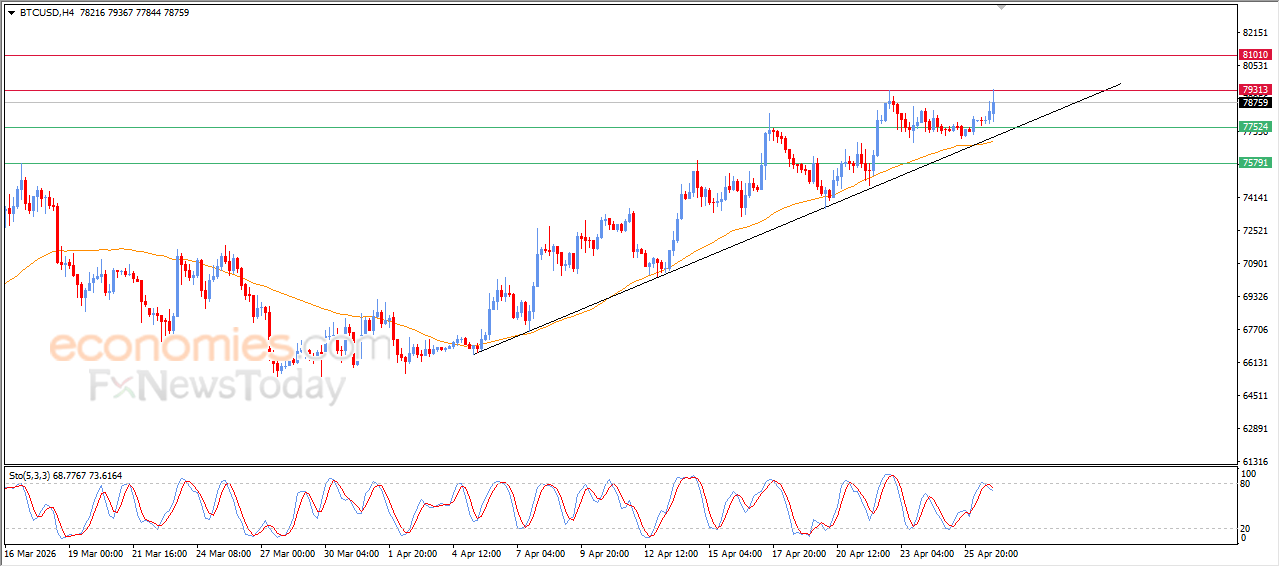
Bitcoin (BTCUSD) price rose during its recent intraday trading, reaching the key resistance level at $79,300, which was a target in previous analyses, supported by the trading above EMA50, along with the dominance of the main bullish trend in the short term and movement along a supportive bullish trendline.
Despite this positive momentum, some warning signals have started to appear, as negative indications begin to emerge from relative strength indicators after reaching overbought levels. This may limit the price’s ability to break this resistance in the near term, potentially leading to sideways movement or a temporary corrective pullback before another attempt to rise.
Crude oil prices extend gains with strong technical support - Analysis- 27-04-2026
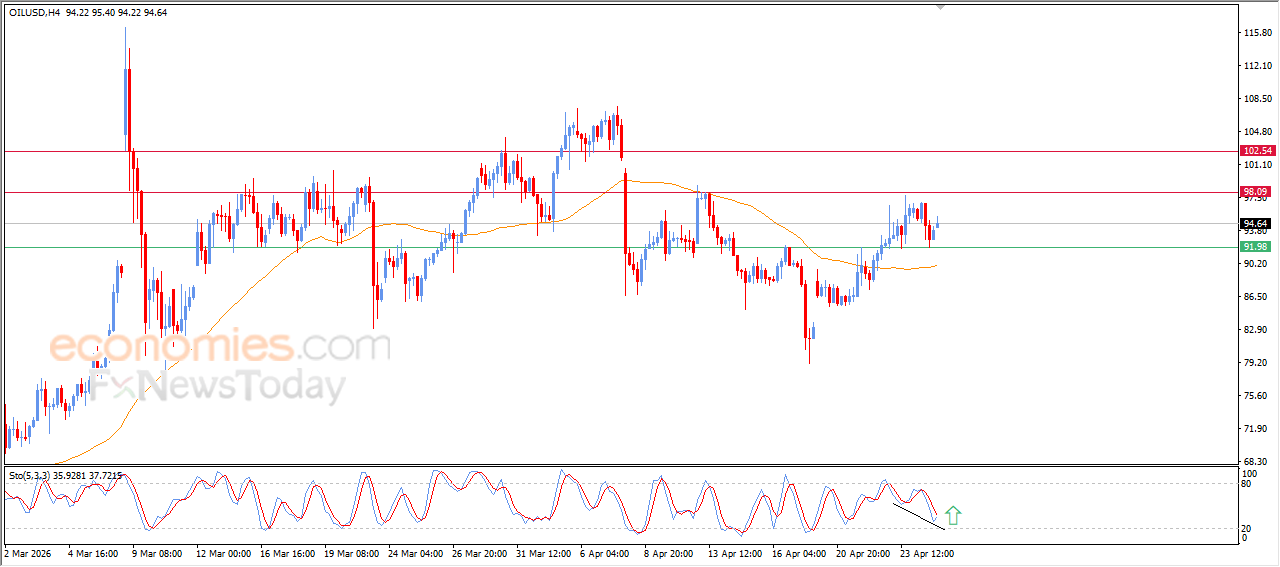
Crude oil price extended its gains during recent intraday trading, supported by stability above the key support level at $92.00, which provided positive momentum and helped the price continue rising. This performance is supported by the trading above EMA50, which acts as dynamic support, strengthening the short-term bullish trend.
Positive signals are also increasing, as a positive divergence begins to form on relative strength indicators after reaching oversold levels compared to price movement, along with the emergence of a positive crossover. This supports the chances of continued upward movement and further gains in the near term.
Silver price signals further decline - Analysis- 27-04-2026
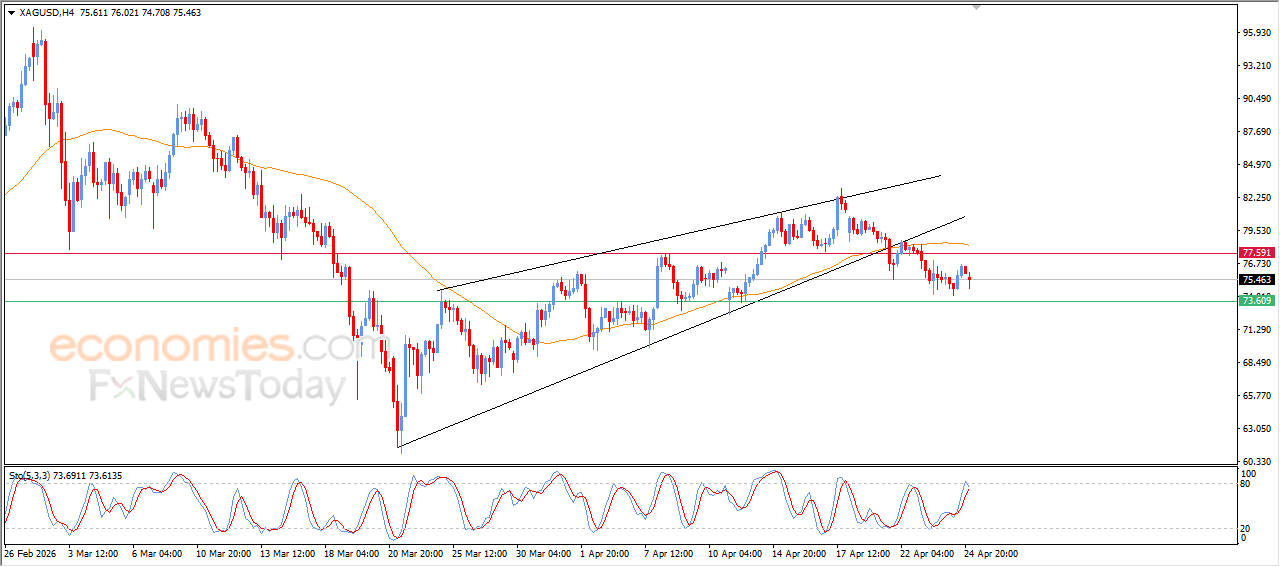
Silver price declined during its recent intraday trading, affected by a previously formed negative technical pattern represented by a rising wedge on the short-term chart, which increased selling pressure and pushed the price to continue falling.
This scenario is reinforced by the trading below EMA50, which acts as a dynamic resistance putting pressure on price movements. At the same time, relative strength indicators have reached overbought levels and started to show a negative crossover, supporting the likelihood of continued decline in the near term.