GBPUSD price is reinforcing its cautious gains- Analysis- 04-02-2026
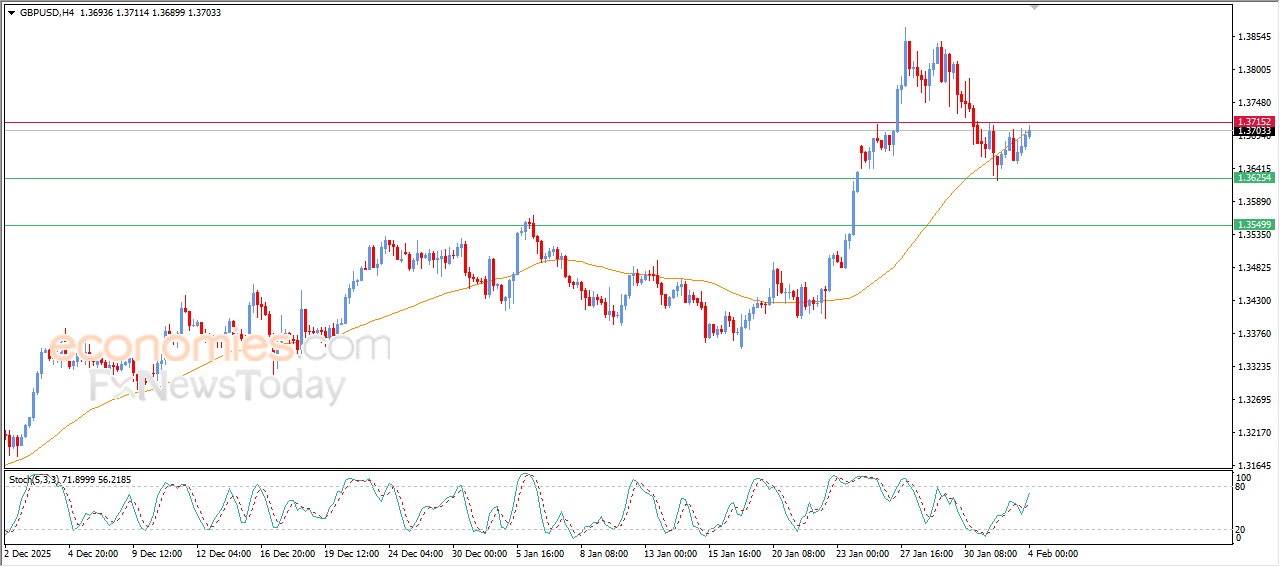
GBPUSD rose in its last intraday trading supported by the emergence of positive signals from relative strength indicators, and the price remains under negative pressure due to its trading below EMA50, and under the dominance of steep bearish corrective wave on short-term basis, these last gains are considered as attempts to recover some of the previous losses.
Bitcoin (BTCUSD) rises after reaching our expected target- Analysis-04-02-2026
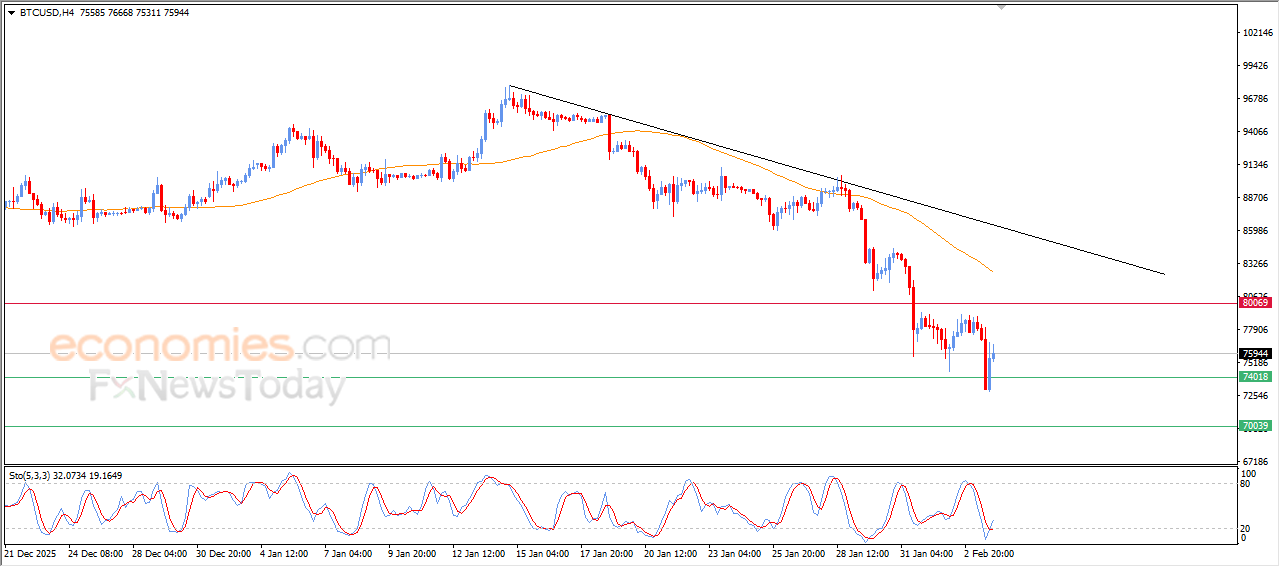
Bitcoin’s price rose during its last intraday trading, benefiting from the stability of key support at $74,000, which represents expected target in our previous analysis, which provided bullish momentum that helped it to record limited gains in attempt to recover some of its losses during the last bearish wave.
This rise remains surrounded by clear negative pressure, with the continuation of the trading below EMA50, which reinforces the dominance of the main bearish trend on short-term basis, accompanied by the attempts of the relative strength indicators to offload its oversold conditions, and the emergence of positive signals might support the fluctuation of temporary rebound, without necessarily implying a confirmed reversal of the trend at the current time.
Crude oil prices extend gains- Analysis-04-02-2026
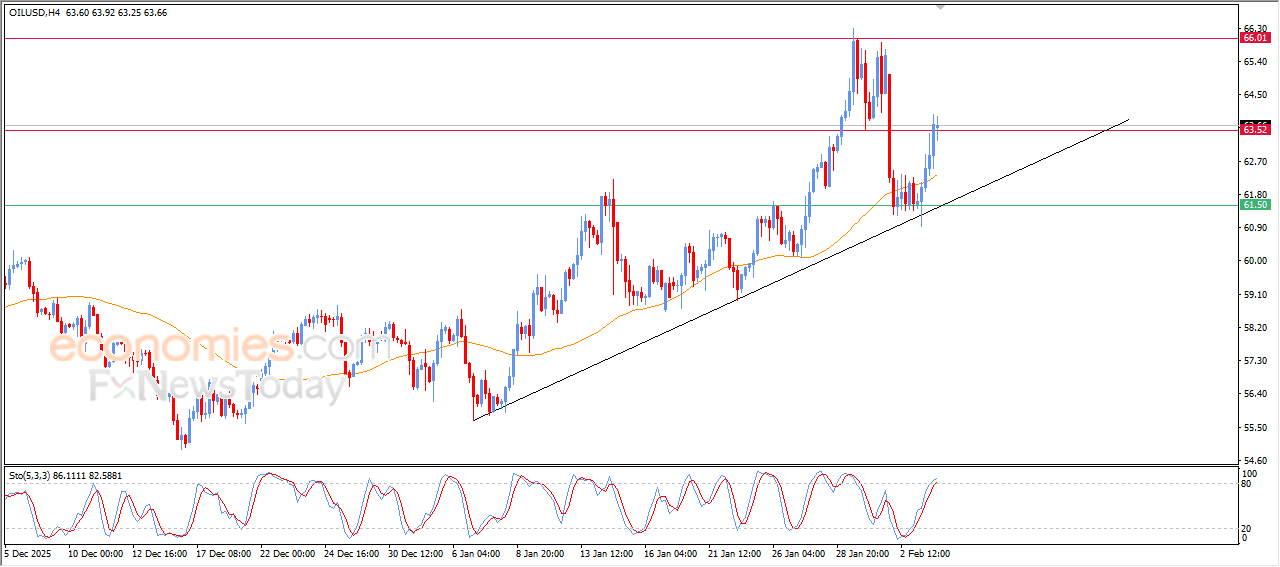
Crude oil prices kept rising in their last intraday trading, to attack the near resistance at $63.50, taking advantage of its trading above EMA50, which represents a key dynamic support that reinforces the stability and dominance of the main bullish trend on short-term basis, and the price is moving alongside supportive trend line for this path, indicating the strength of the bullish momentum.
This bullish performance is supported by the positive signals from relative strength indicators, which confirms the momentum improvement and opens the way for breaching this resistance, if it happens, we will witness extra gains in the near term.
Silver Price is showing a negative divergence that threatens its temporary gains– Analysis-04-02-2026
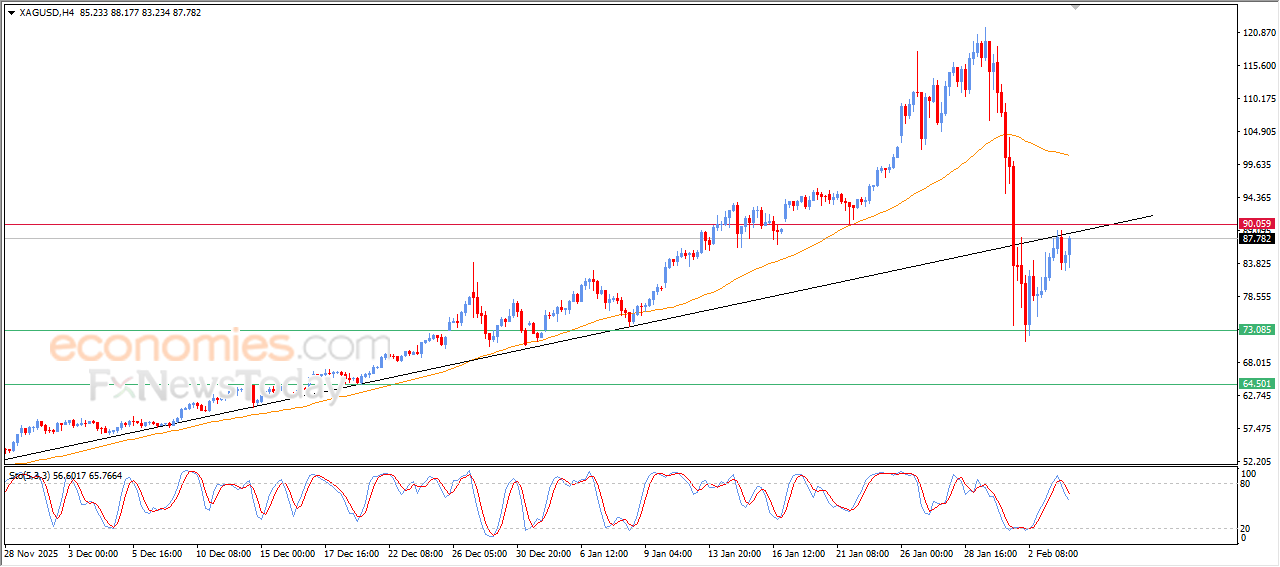
Silver prices (SILVER) rose in their recent intraday trading, to retest previously broken main bullish trend line, in attempt to confirm this break before detecting the next trend, this bullish track comes despite the continuation of the negative pressure due to its trading below EMA50, which still represents dynamic resistance that limits the strength of the current rebound.
Noticing a clear negative divergence of relative strength indicators after reaching exaggerated overbought levels compared to the price move, accompanied by the emergence of negative signals, which reinforces the likelihoods of the intraday rebound failure and a return to the selling pressures, unless the price manages to trade above the broken trend line.