


 |
The EURUSD tests the channel’s resistance - 18-10-2023
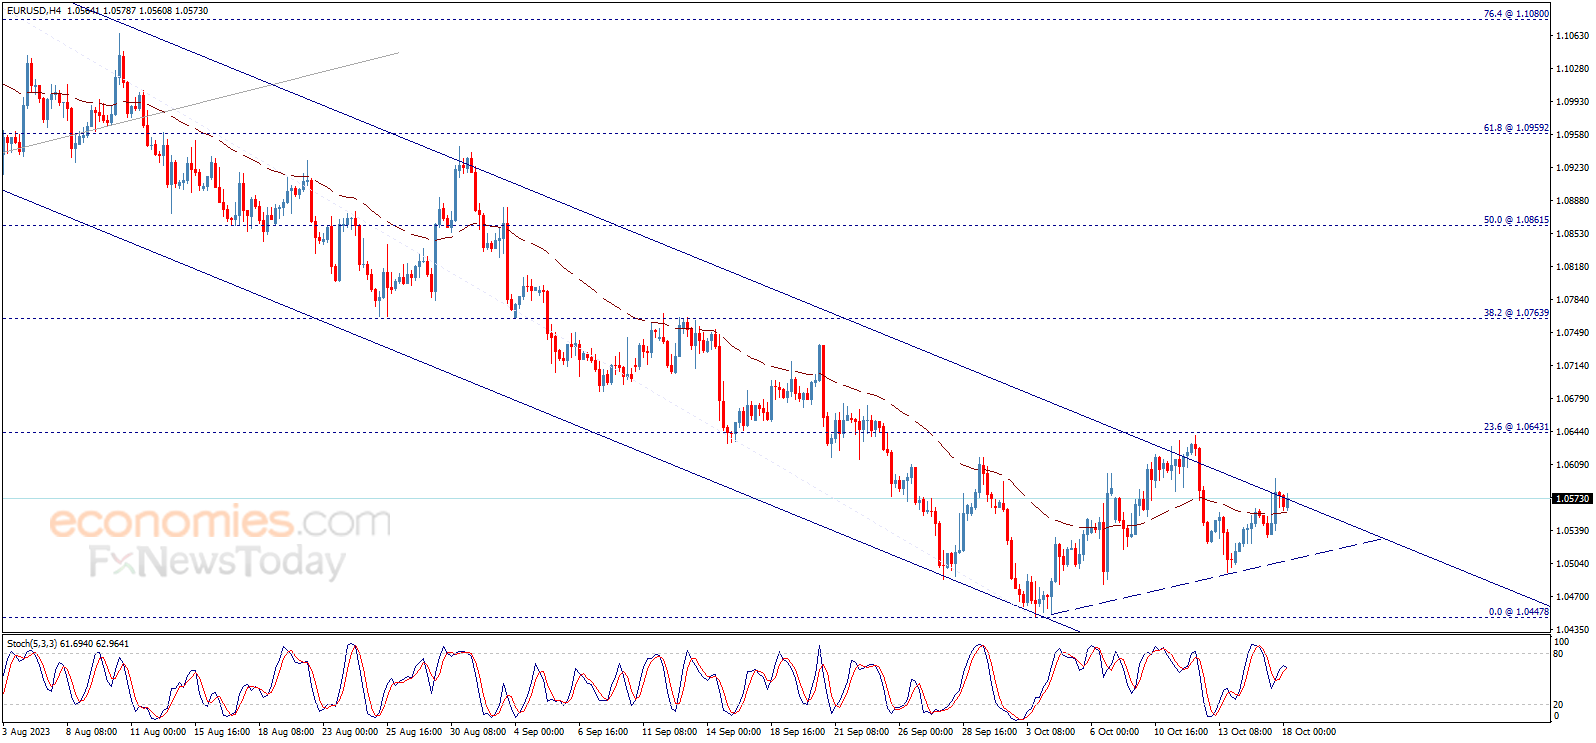
The EURUSD pair traded positively in the previous sessions to test the main bearish channel’s resistance that appears on the chart, waiting to rebound bearishly to resume the bearish trend again, which targets 1.0510 followed by 1.0450 levels mainly.
Therefore, we will continue to suggest the bearish trend for the upcoming period, depending on the price stability below the mentioned channel’s resistance, as breaching this resistance at 1.0575 represents the key to start bullish wave and achieve gains that start by testing 1.0640 areas.
The expected trading range for today is between 1.0480 support and 1.0630 resistance.
The expected trend for today: Bearish
Thanks for your feedback.
Chevron shakes off negative pressures - Analysis - 17-10-2023
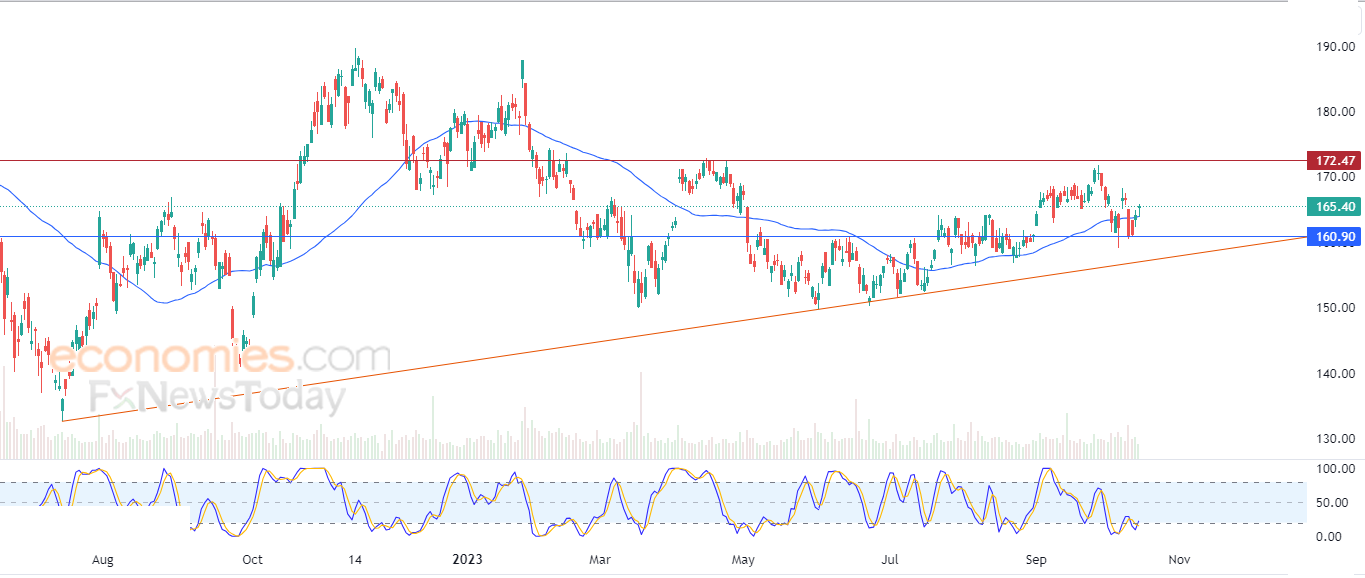
Chevron Corporation's stock (CVX) rose in the intraday levels, managing to shake off negative pressure from the 50-day SMA, amid the dominance of the main upward trend in the medium term, with positive signals from the RSI after reaching oversold levels.
MoreETSY touches SMA resistance - Analysis - 17-10-2023
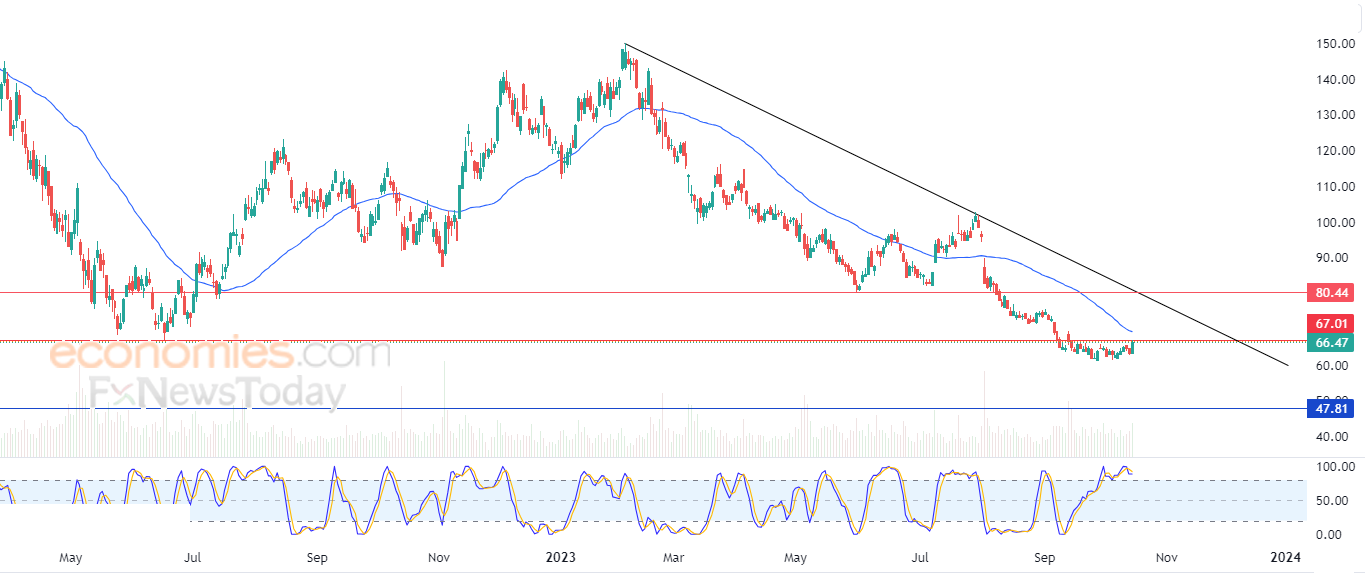
ETSY's stock rose in the intraday levels, while recouping some recent losses, and retesting the pivotal resistance of 67.00, while touching the resistance of the 50-day SMA, amid the dominance of the main downward trend in the medium term, while trading alongside the short term, coupled with negative signals from the RSI after reaching overbought levels compared to the stock's movements.
MoreDollar General tries to correct main downward trend - Analysis - 17-10-2023
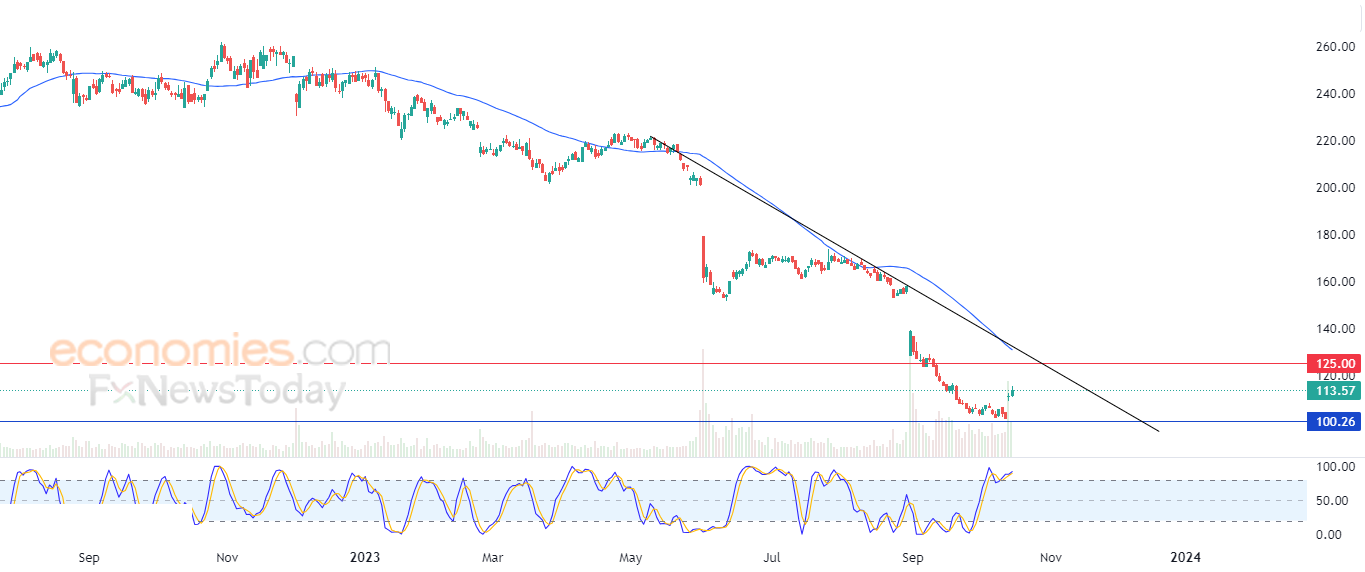
Dollar General Corporation's stock (DG) rose in the intraday levels, while correcting the main downward trend as the stock trades alongside the short-term trend line, with negative pressure from the 50-day SMA, as the RSI reached overbought levels compared to the stock's movements, hinting at a negative divergence, and doubling negative pressures on the stock.
More