Evening update for EURUSD-26-06-2026
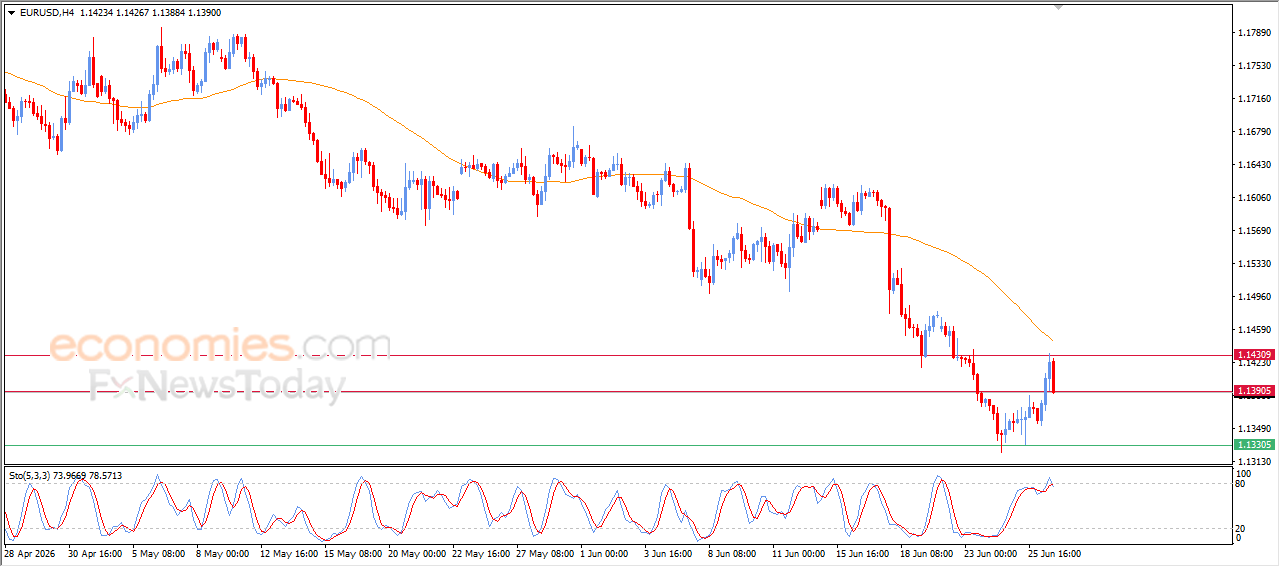
The EURUSD pair slipped lower in its latest intraday trading, erasing most of its gains for today, amid the continuation of the negative pressure due to its trading below EMA50, with the dominance of the main bearish trend on the short-term basis, noticing that the relative strength indicators entered overbought levels, exaggeratedly compared to the price move, as a clear signals for fading the surrounding bullish momentum.
Forecast update for Ethereum -26-06-2026
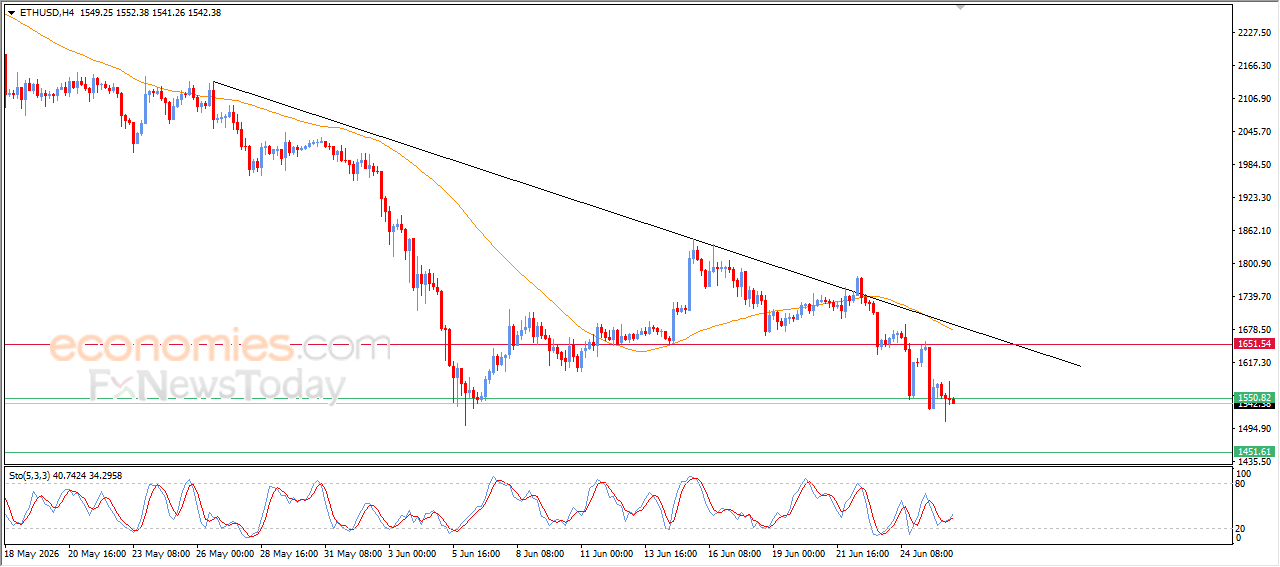
(ETHUSD) fluctuated in its latest intraday trading, affected by the emergence of the positive signals from the relative strength indicators, after reaching oversold levels, with the stability of the key support at $1,550, providing bullish momentum that helps it to settle against the negative pressures, where the price is under negative pressure that comes from its trading below EMA50, which reinforces the stability and dominance of the main bearish trend on the short-term basis.
Forecast update for Brent -26-06-2026
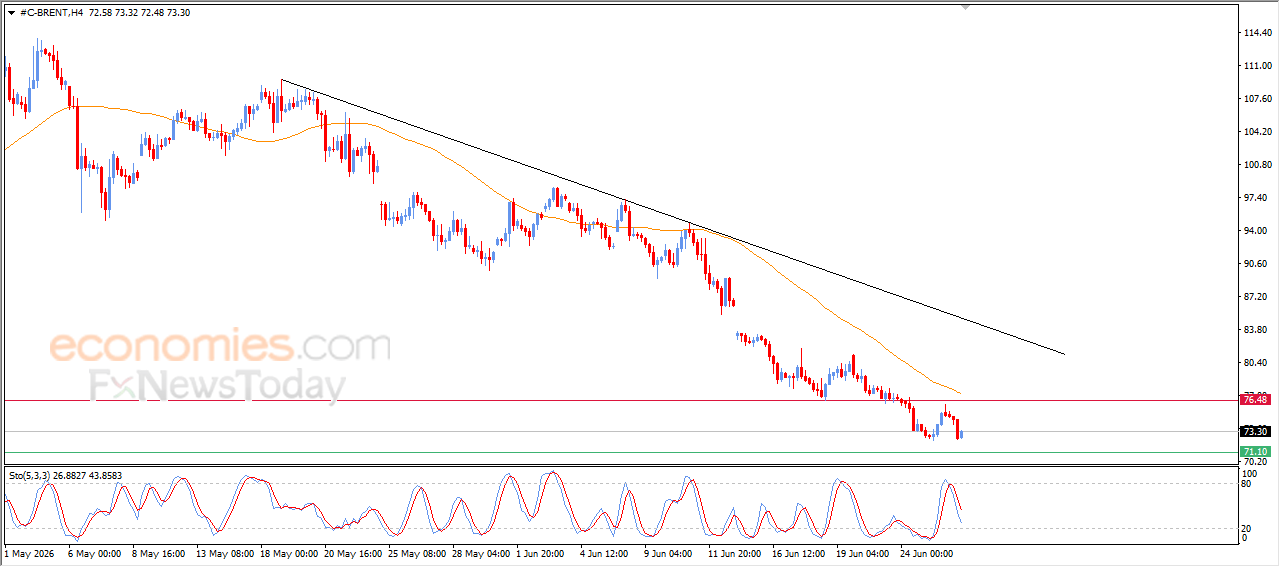
Brent crude oil declined in the latest trading on the intraday levels, with the emergence of the negative signals from the relative strength indicators, after reaching overbought levels, with the continuation of the negative pressure that comes from its trading below EMA50, reinforcing the stability and dominance of the main bearish trend on the short-term basis, with its trading alongside supportive trend line for this path.
Forecast update for Bitcoin -26-06-2026
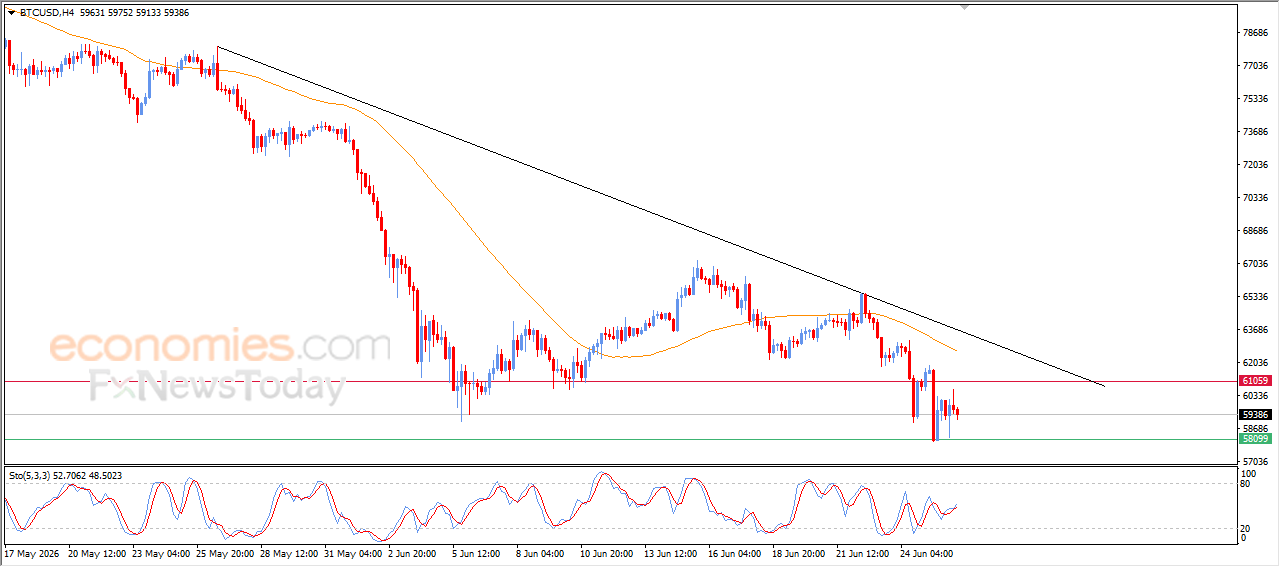
The price of Bitcoin witnessed fluctuating trading during its recent intraday trading, amid the dominance of the main bearish trend on the short-term basis, with its trading alongside supportive trend line for this path, with a dynamic resistance that obstructs the full recovery in the upcoming near period, which represents EMA50’s resistance, on the other hand, we notice the emergence of the positive signals from the relative strength indicators, which helped the price to settle against these pressures temporarily.