


 |
Evening update for EURUSD-02-03-2026
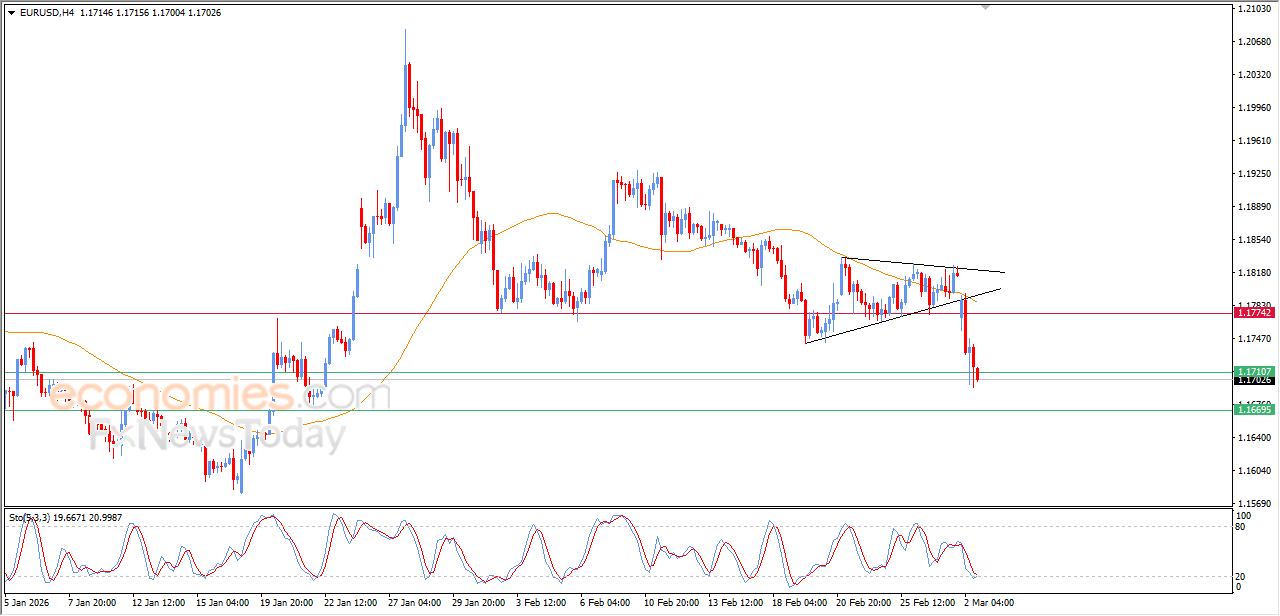
(EURUSD) kept declining in its last intraday trading, breaking our previous expected target at 1.1710 support, affected by technical negative formation that completed the bearish corrective trend (the symmetrical triangle pattern) with the continuation of the negative pressure due to its trading below EMA50, besides the emergence of the negative signals from relative strength indicators.
Thanks for your feedback.
Monero coin price shows mixed signals - Analysis - 02-03-2026
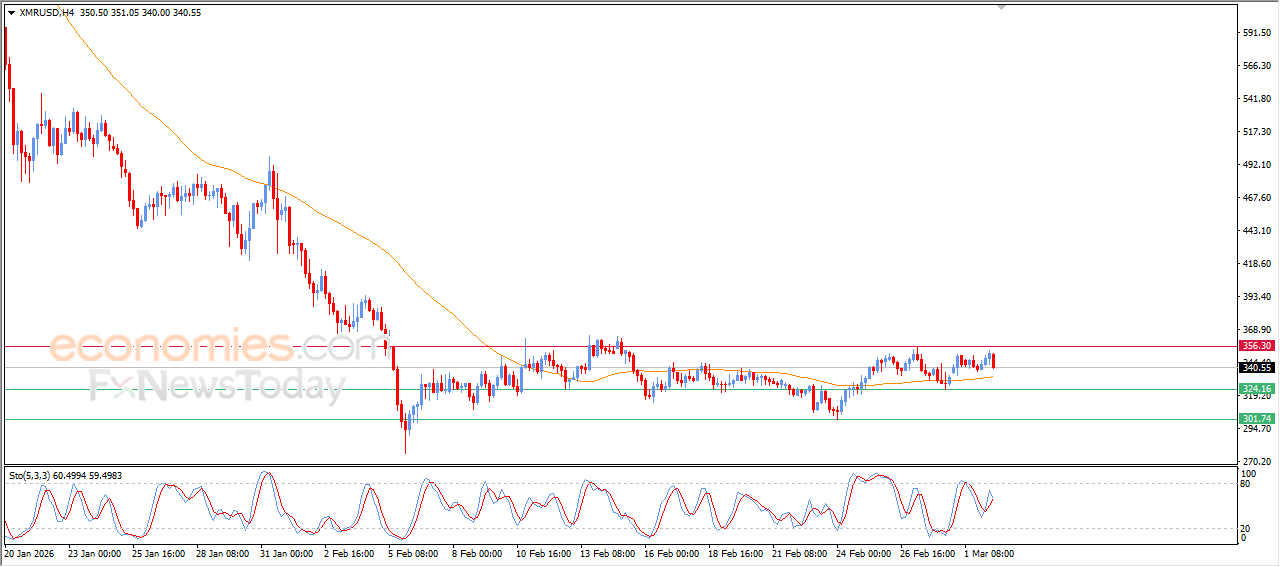
Monero Coin (XMRUSD) price declined during its latest intraday trading, following the firm holding of the key resistance level at $356.30. A negative crossover has started to appear on the RSI after reaching overbought territory, diverging from price action and signaling the early formation of a bearish divergence. However, on the other hand, the price is still supported by the dynamic support represented by trading above the 50-period simple moving average, while a short-term corrective upward trend remains in control.
MoreAMD price suffers from negative pressure - Forecast today - 02-03-2026
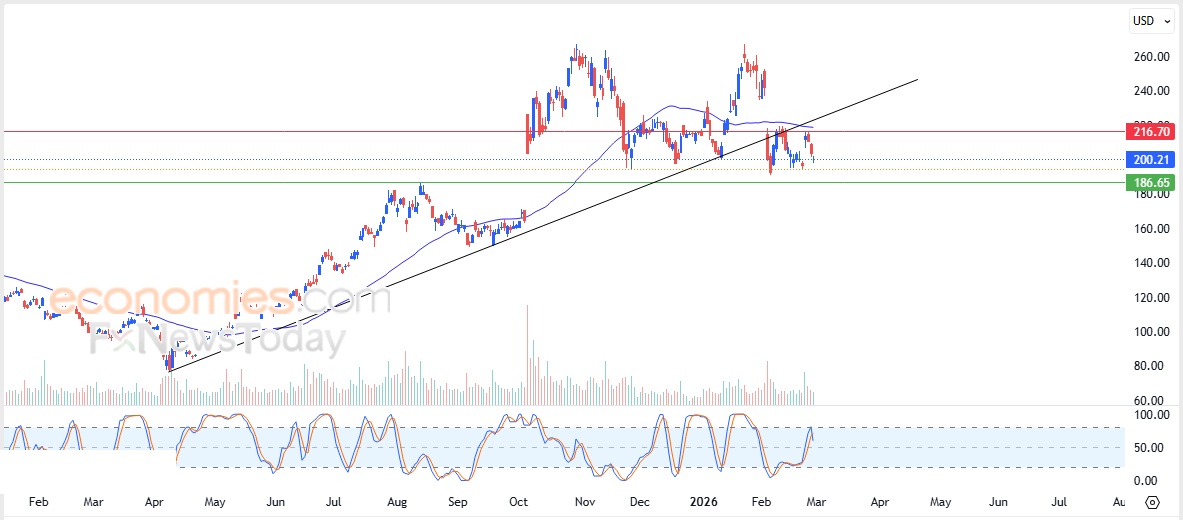
Advanced Micro Devices Inc. (AMD) stock price declined during its latest intraday trading, amid the dominance of a short-term corrective bearish wave and following the earlier break of a major upward trendline. The stock continues to face negative pressure as it trades below its 50-day simple moving average, which reinforces the bearish outlook. In addition, a negative crossover is beginning to appear on the RSI after reaching overbought territory, adding further downside pressure to the price.
MoreConocoPhilips price shows more positive signs - Forecast today - 02-03-2026
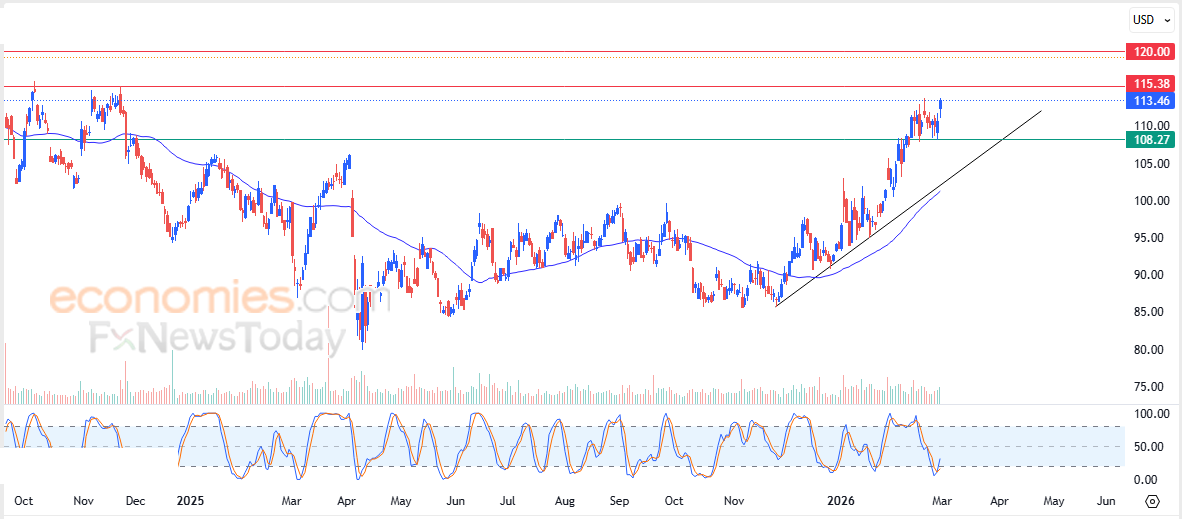
ConocoPhillips (COP) stock price strengthened its gains during its latest intraday trading, supported by the beginning of a positive divergence on the RSI after reaching extremely oversold levels in an exaggerated manner compared to price action. Positive signals are starting to emerge from the indicator, preparing the stock to challenge the key resistance level at $115.40. This comes amid the dominance of the main upward trend in the short term, with price movements aligned along a supportive secondary trendline, while dynamic support remains in place as the stock trades above the 50-day simple moving average.
More