The AUDUSD price maintains uptrend - Analysis-27-04-2026
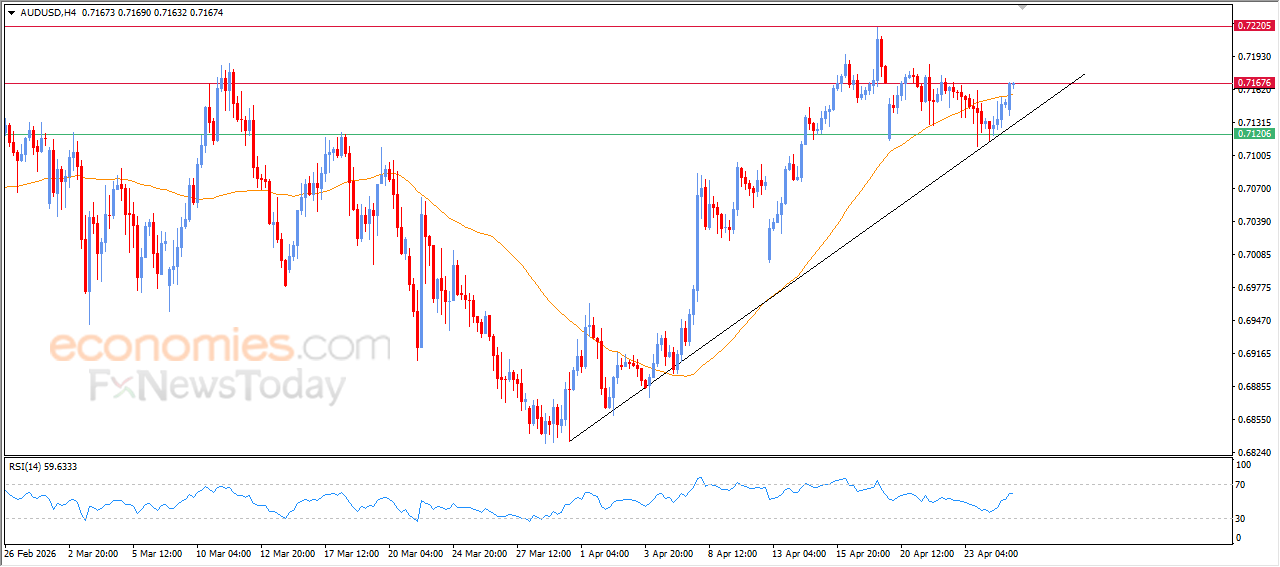
The AUDUSD pair surged during its recent intraday trading, as it leaned on a key short-term bullish trendline previously, which provided strong positive momentum, reinforced by improving signals from relative strength indicators after reaching oversold conditions, to break above the EMA50, which previously acted as resistance, to get rid of the negative pressure and opens the way for achieving more gains in the near upcoming period.
The USDCAD price under negative pressure - Analysis-27-04-2026
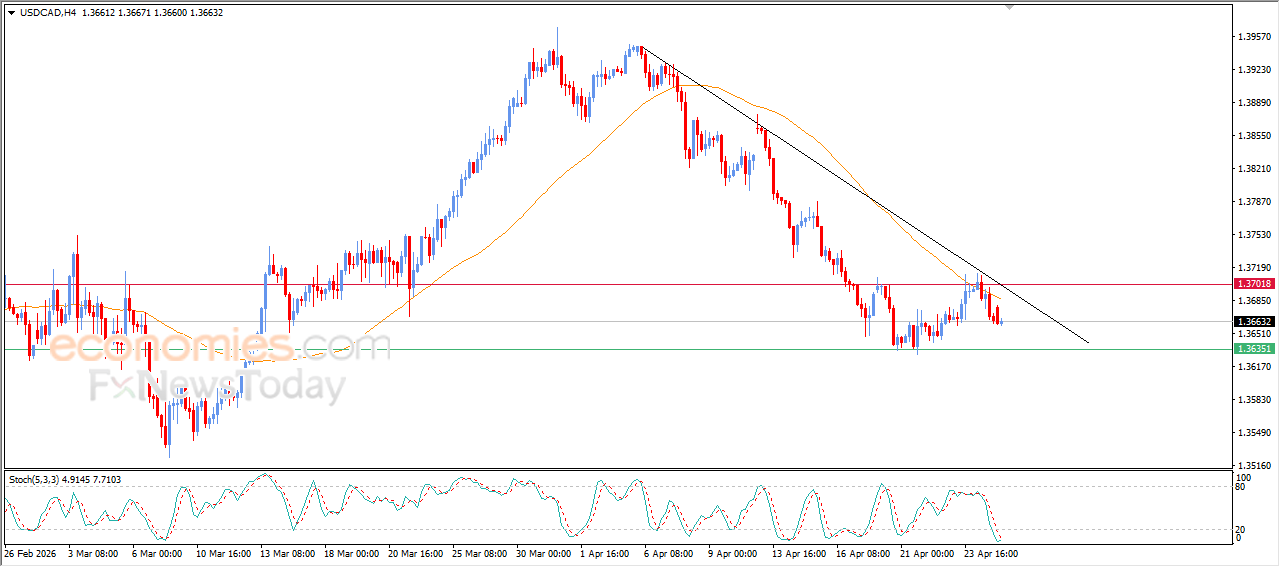
The USDCAD pair declined during its recent intraday trading, following the price being below the key resistance level at 1.3700, as previously expected. This comes amid continued bearish pressure due to trading below EMA50, which reinforces the dominance of a short-term corrective downtrend, especially as the price moves alongside a supporting bearish trendline.
On the other hand, a positive crossover started to appear on relative strength indicators after reaching deeply oversold levels, which may limit further losses and lead to sideways consolidation before any renewed decline.
The USDJPY price looks for a higher low -Analysis-27-04-2026
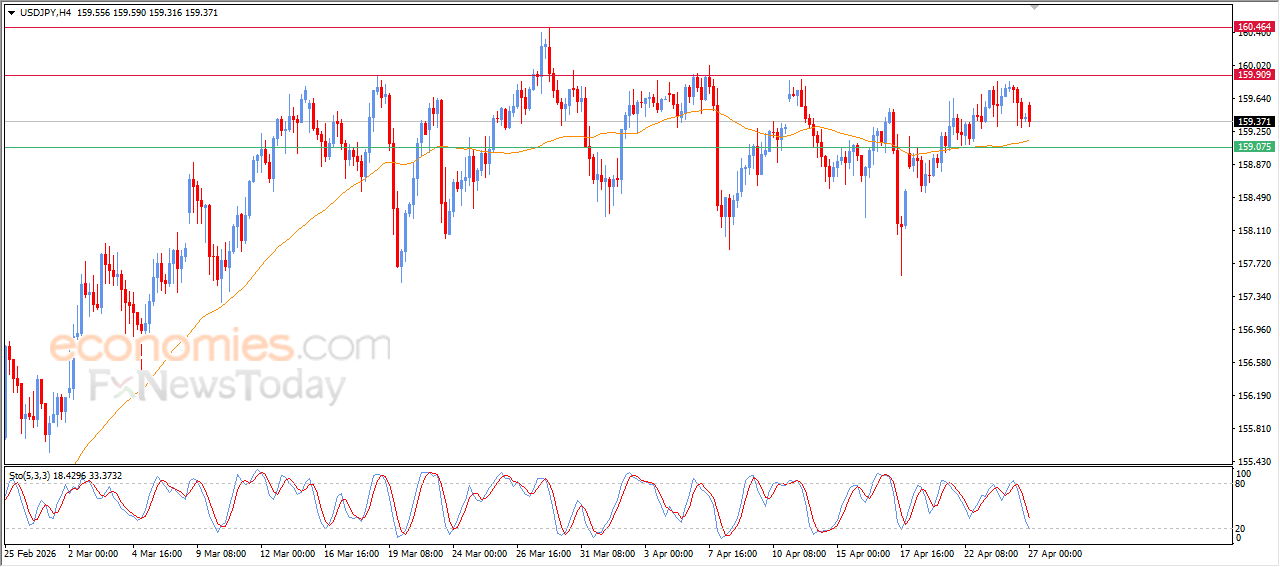
The USDJPY pair declined during its recent intraday trading, as it attempts to form a higher low that could act as a base to regain positive momentum and resume its upward movement. This comes amid the dominance of a strong short-term bullish wave, along with continued positive and dynamic support from trading above the EMA50, which enhances the chances of recovery.
This outlook is supported by relative strength indicators reaching deeply oversold levels compared to the pair’s price movement, indicating potential rebound.
GBPUSD price struggles to overcome negative pressure - Analysis- 27-04-2026
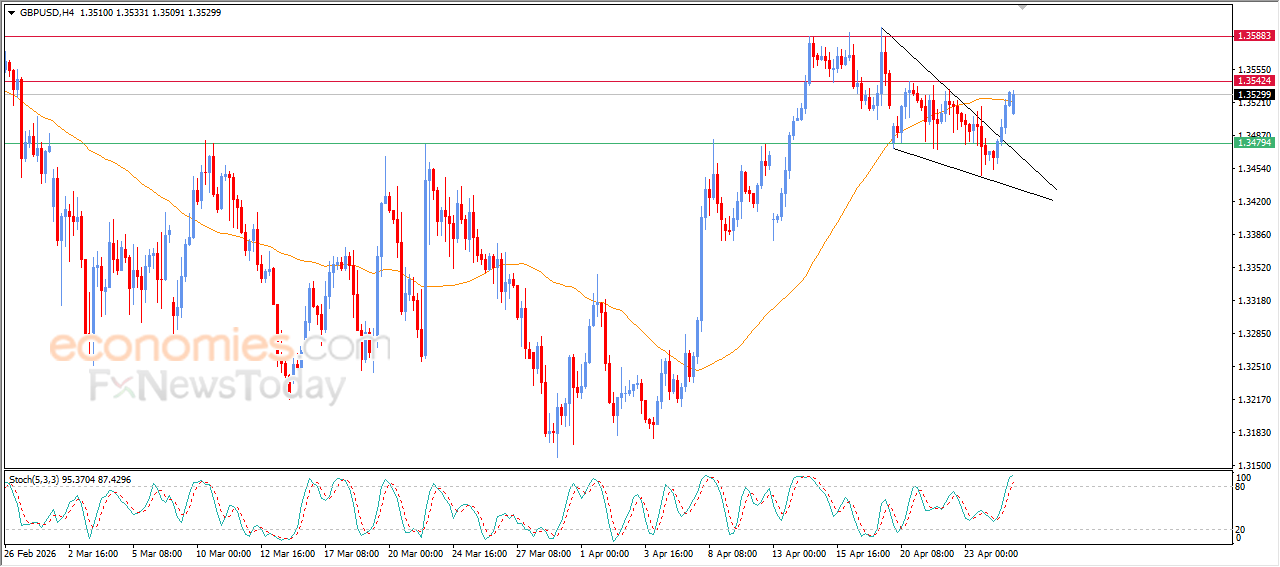
The GBPUSD pair extended its gains during recent intraday trading, supported by breaching the upper boundary of a negative technical formation that developed during a short-term corrective wave, specifically a falling wedge pattern, supported by positive signals from relative strength indicators. However, these indicators have reached heavily overbought levels, which may limit further gains in the near term and could lead to sideways movement or even a temporary decline in search of a higher low, reinforced by facing resistance at EMA50, which increases the pressure.