NZDUSD is leaning on its simple moving average support-Analysis-18-11-2025
The (NZDUSD) price declined in its last trading on the intraday levels, amid its attempts to look for rising low to take it as a base to gain the required bullish momentum to recover, leaning on the support of its EMA50, accompanied by testing bullish corrective trend line on the short-term basis, the relative strength indicators reached oversold levels and that is reinforcing the chance of a recovery, and indicates forming positive divergence, especially with the emergence of positive overlapping signals.
The USDCAD price is getting rid of its negative pressure- Analysis-18-11-2025
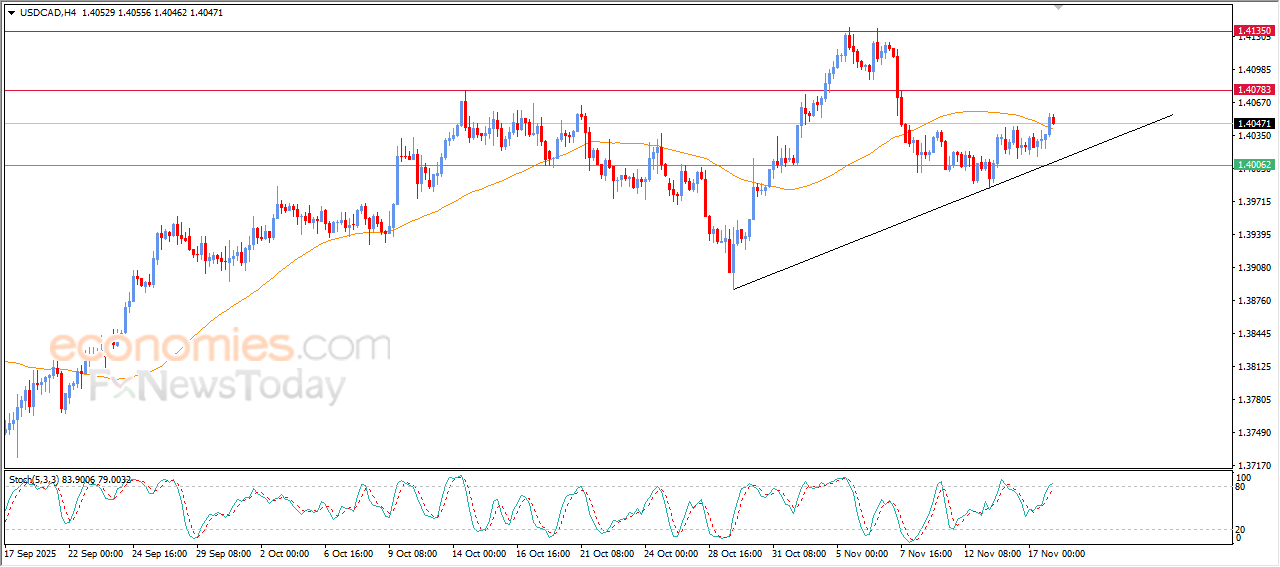
The (USDCAD) price settled with gains in its last intraday trading, supported by the emergence of the positive signals on the relative strength indicators, with its trading alongside minor bullish trend line on the short-term basis, to surpass the resistance of its EMA50, to get rid of its negative pressure, and opening the way for targeting new resistance levels in the upcoming period.
The USDJPY is extending its gains-Analysis-18-11-2025
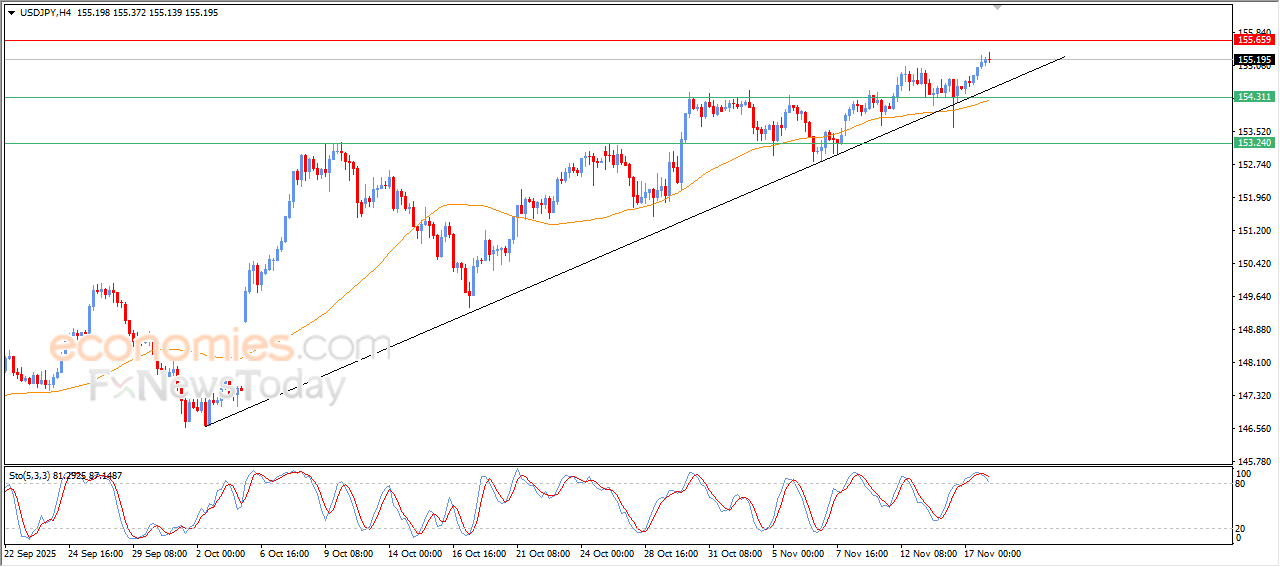
The (USDJPY) kept rising in its last intraday trading, taking advantage of the dominance of the main bullish trend on the short-term basis, with its trading alongside supportive trend line, besides the continuation of the dynamic support that is represented by its trading above EMA50, which reinforced the stability of the bullish movement in the last period, on the other hand, we notice the beginning of negative signals appearance on the relative strength indicators, after reaching overbought levels, which might reduce the gains in the upcoming period.
GBPUSD price is leaning on the support of its simple moving average- Analysis-18-11-2025
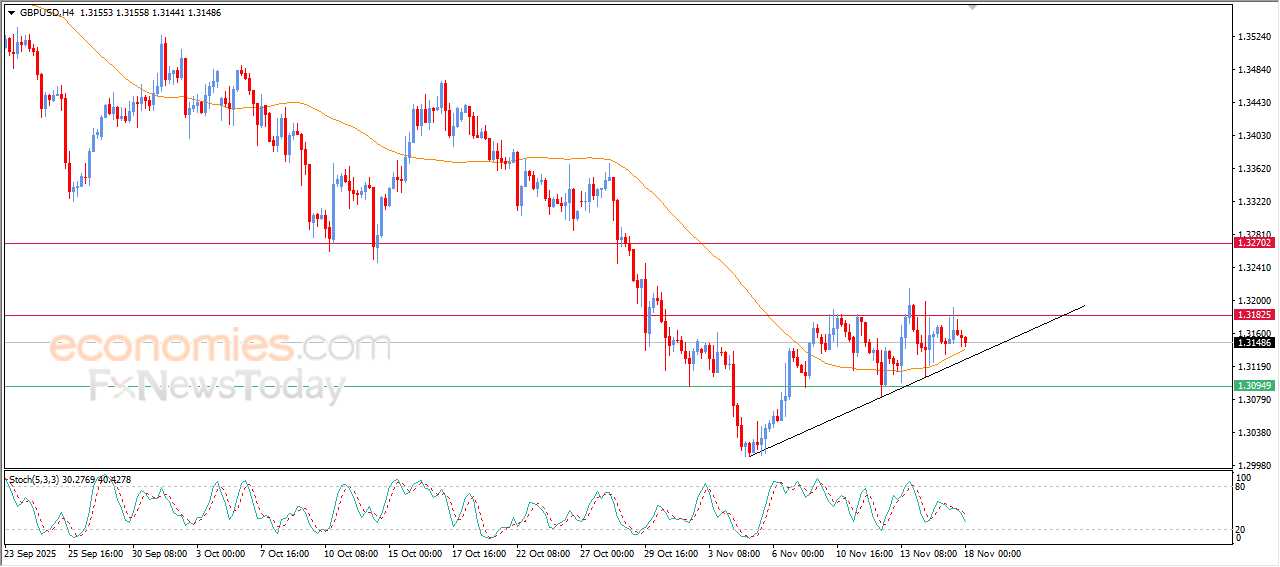
The (GBPUSD) price declined in its last intraday trading, due to the stability of the resistance at 1.3185, which represents a barrier against extending the current corrective bullish wave, this decline came with the attempt of gaining bullish momentum that might allow it breach this resistance, leaning on the support of its EMA50, taking advantage of its trading alongside supportive trendline for this bullish trend.
On the other hand, the negative signals come from the relative strength indicators, indicating the weakness of the bullish momentum, this technical divergence might reduce the ability to surpass the current resistance in the near period.