NZD/CAD Achieves Tangible Gains – Today's Forecast – 18-03-2025

The pair’s price exploited the positive pressure resulting from the formation of the 55-period moving average as a new support, centered around 0.8185, in addition to the positive momentum exhibited by the Stochastic indicator. This allowed the price to surge recently above the stable resistance at 0.8255, marking its transition into an uptrend and recording tangible gains by reaching approximately 0.8330.
We expect the formation of a primary support level at 0.8260 in the current trading session. With the continued presence of key bullish momentum indicators, the price is anticipated to resume its upward drive, targeting 0.8372 soon. If this barrier is breached, 0.8415 will become the next primary target for the bullish move.
The expected trading range for today is between 0.8295 and 0.8372.
Today's Price Forecast: Bullish
To get our more detailed analysis and 100% accurate signals provided by Best Trading Signal, subscribe to Economies.com VIP Club through the link below!
Natural Gas Price Remains Up – Today's Forecast – 18-03-2025

Yesterday, the gas price failed to confirm its breakthrough of the stable barrier at $4.180, forcing it to form temporary negative trades by sliding towards $4.000, in order to maintain its overall stability above the support of the ascending channel, currently around $3.950.
We observe that the Stochastic indicator is beginning to show positive momentum by emerging from the oversold level, which gives the price a new opportunity to form upward waves and increases the chances of it surpassing the $4.180 level to reach the positive targets currently set around $4.280 and $4.450, respectively.
The expected trading range for today is between $3.950 and $4.280.
Today's Price Forecast: Bullish with support stability
To get our more detailed analysis and 100% accurate signals provided by Best Trading Signal, subscribe to Economies.com VIP Club through the link below!
German Index Price Touches the First Target – Today's Forecast – 18-03-2025
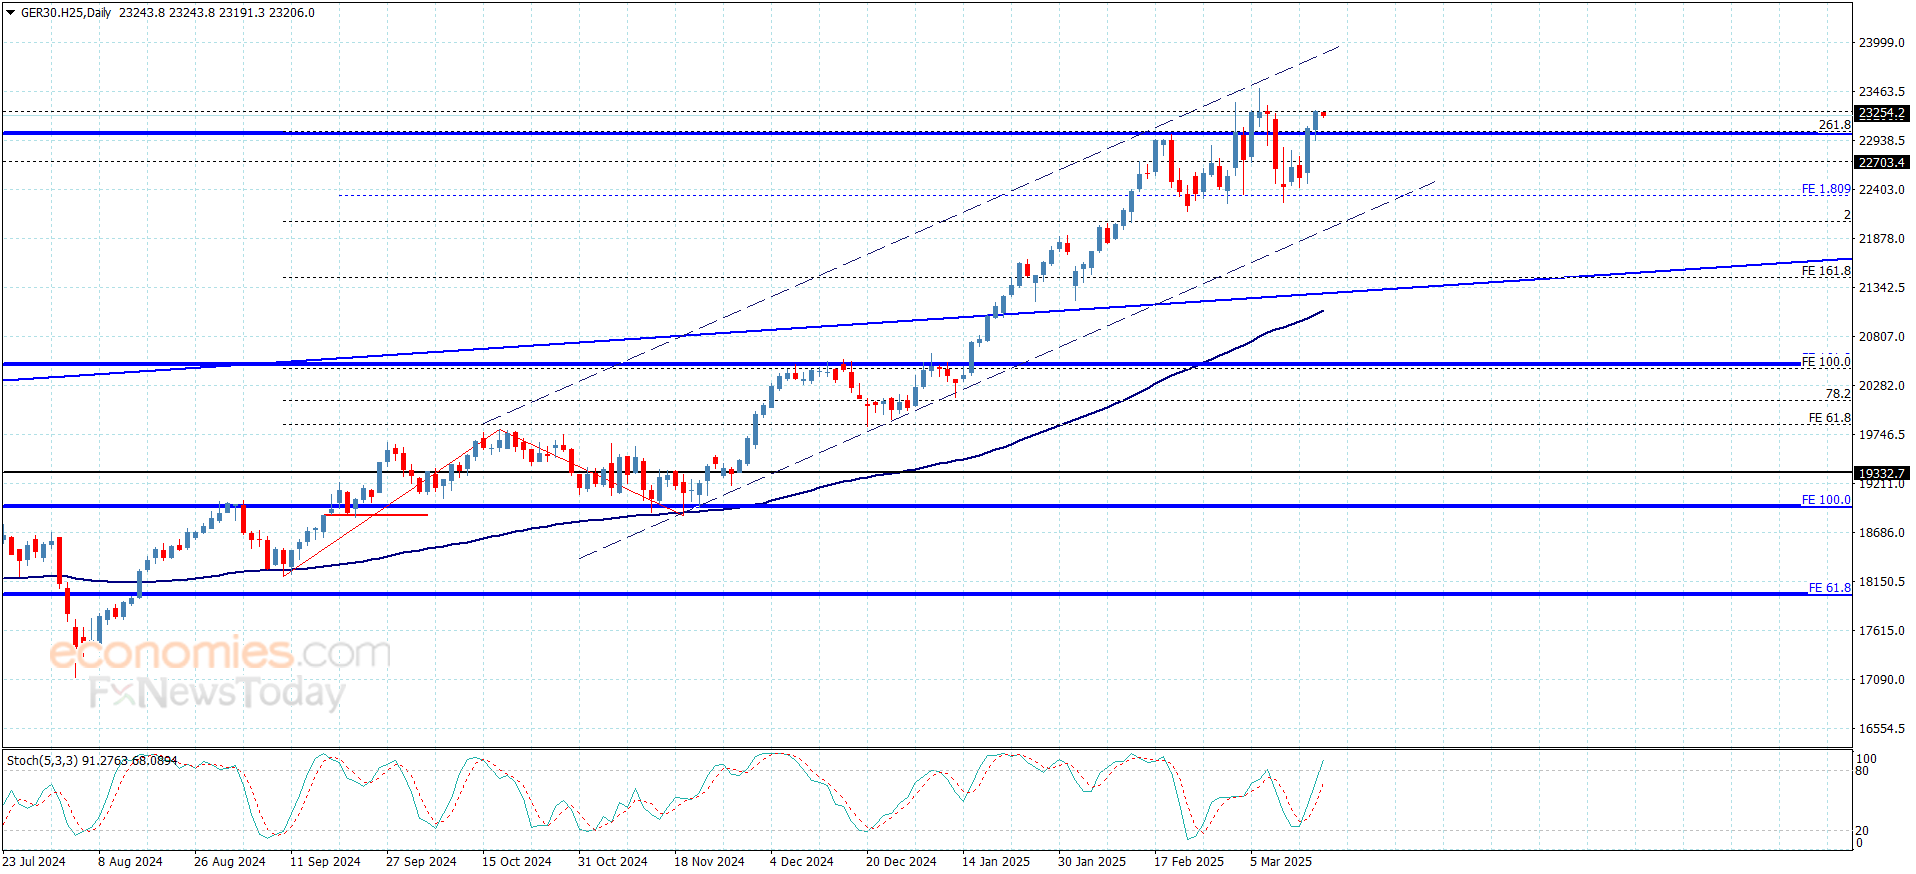
Yesterday, the index's price confirmed its break above the primary stable resistance at 23000.00, forming several upward waves, and is currently consolidating near the first target set at 23255.00.
We note that the continued presence of key bullish momentum indicators—specifically, with the Stochastic indicator reaching the 80 level—will increase the chances of the price resuming its upward drive. We therefore expect it to attack the historical peak currently at 23505.00, and then attempt to record new historic gains by surging towards 23680.00 and 23840.00, respectively.
The expected trading range for today is between 23150.00 and 23505.00.
Today's Price Forecast: Bullish
To get our more detailed analysis and 100% accurate signals provided by Best Trading Signal, subscribe to Economies.com VIP Club through the link below!
Nasdaq Index Tests a Key Barrier – Today's Forecast – 18-03-2025
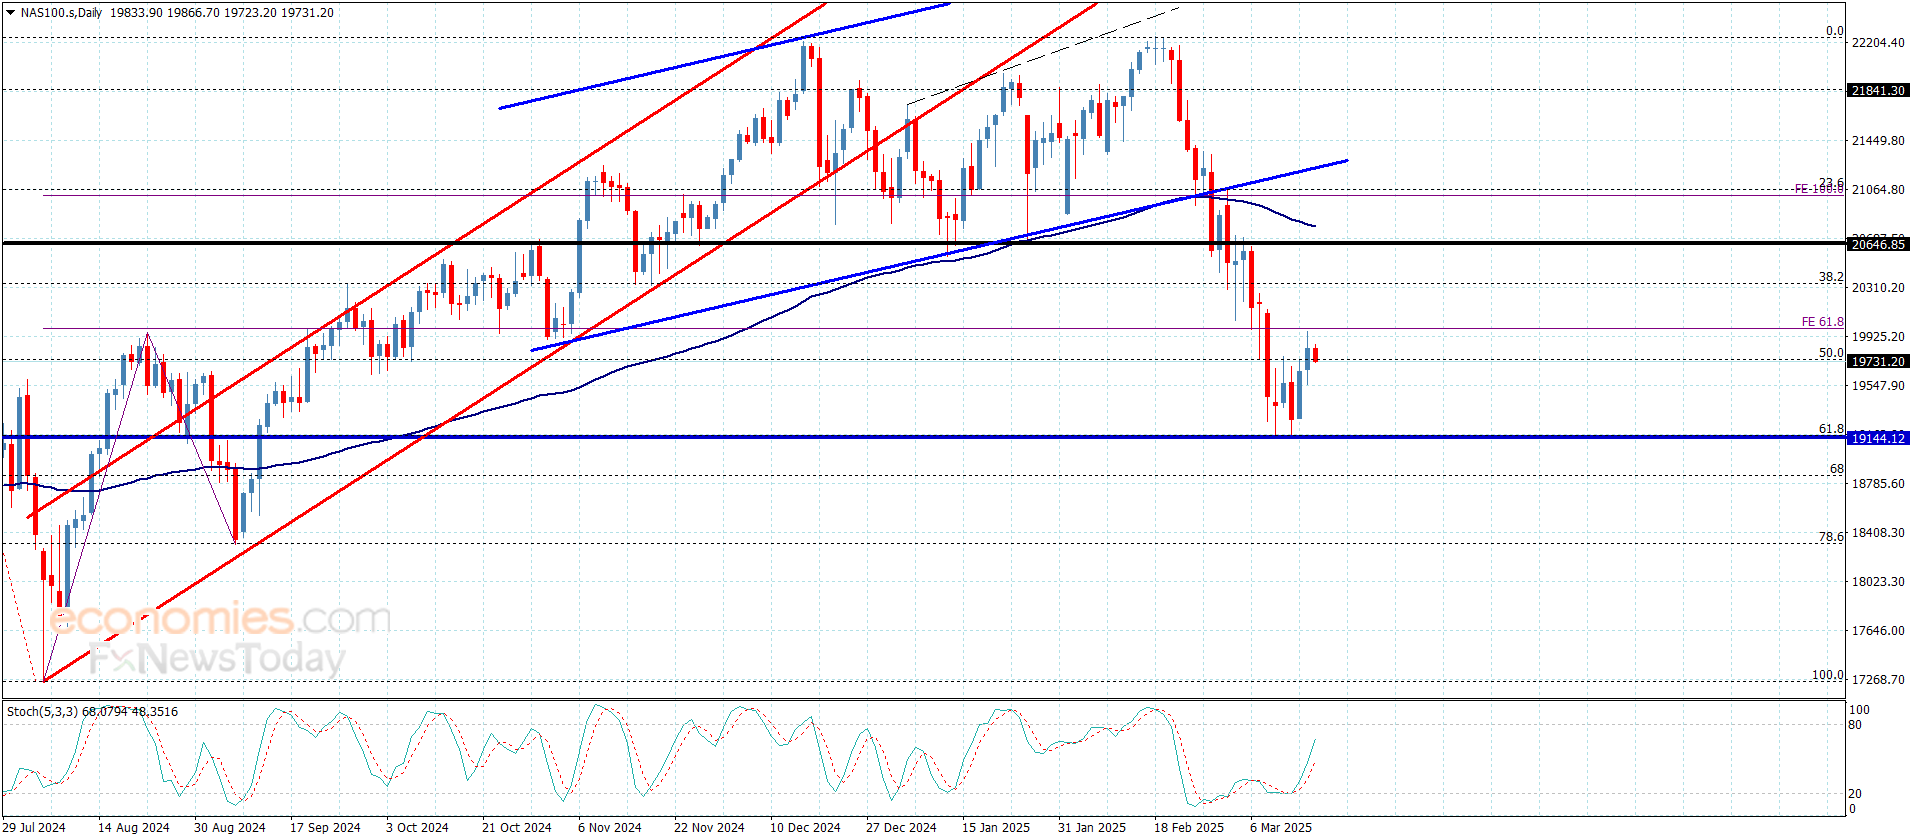
Yesterday, the index experienced strong positive pressure, aligning with its consistent trading above the key support level at 19145.00, which led to the formation of some upward waves as it faces a key barrier at 20000.00, representing the 61.8% extended Fibonacci level.
However, the repeated stability below this barrier confirms the price’s adherence to the bearish scenario, suggesting that new negative waves may form soon to push the price towards 19560.00. If that level is broken, trading may extend again toward the previously mentioned key support. Conversely, if the barrier is broken and the price stabilizes above it, the likelihood of a transition to a bullish scenario increases, with the price potentially targeting new positive levels, making 20180.00 the first positive target for the uptrend.
The expected trading range for today is between 19560.00 and 19950.00.
Today's Price Forecast: Bearish due to barrier stability
To get our more detailed analysis and 100% accurate signals provided by Best Trading Signal, subscribe to Economies.com VIP Club through the link below!