Zcash price gives in to negative pressures - Analysis - 01-06-2026
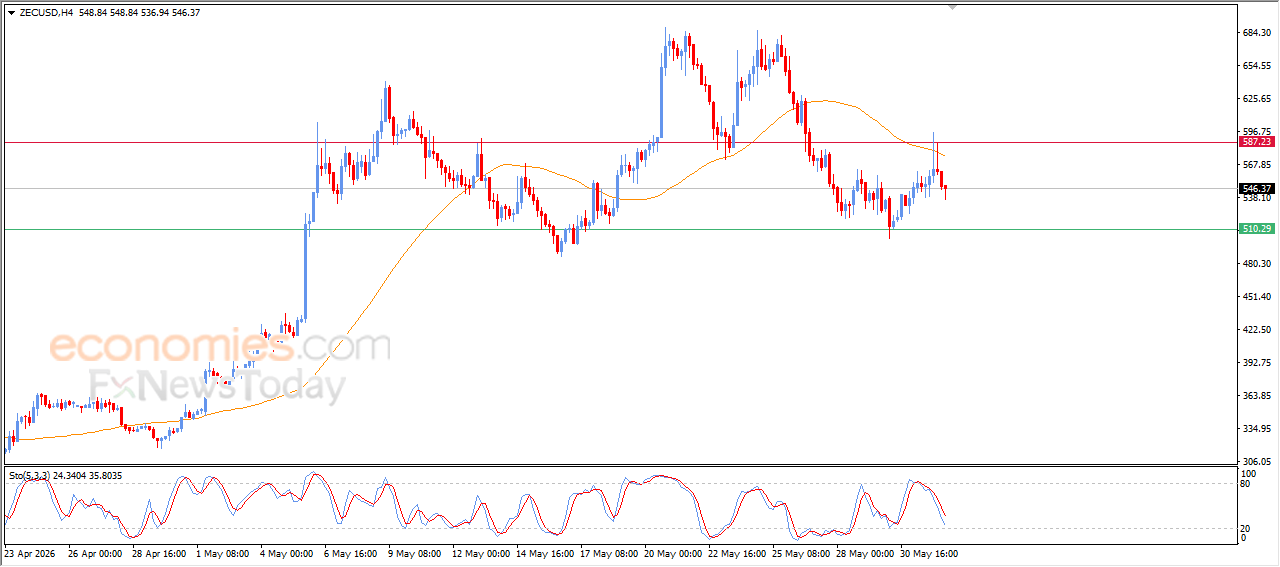
Zcash (ZECUSD) price declined in its latest intraday trading after colliding with the resistance of its 50-day SMA, which forced the price to reverse lower amid the dominance of a short-term corrective bearish wave. This came alongside continued negative signals from the Stochastic indicators after previously reaching deeply overbought levels, increasing the negative pressure surrounding the price and contributing to this decline.
Therefore we expect the digital currency price to decline in its upcoming intraday trading, as long as it remains below the $587.00 resistance level, targeting the key support level at $510.00.
Today’s price forecast: Bearish.
Under Armour price driven lower after testing downward correctional trend line - Forecast today - 01-06-2026
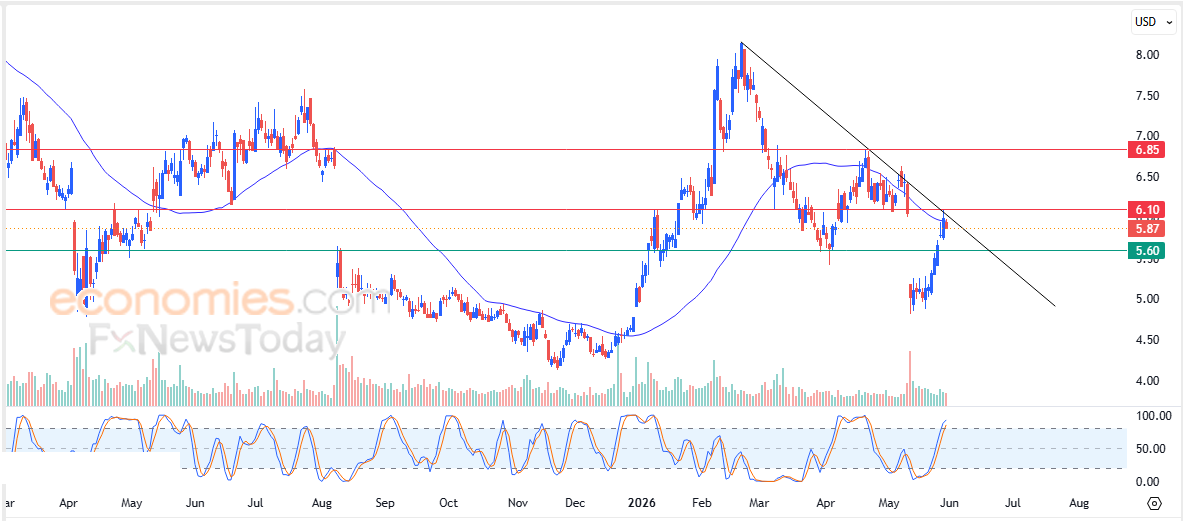
Under Armour (UAA) stock price edged slightly lower in its latest intraday trading after touching the resistance of its 50-day SMA, which coincided with a test of a short-term corrective bearish trend line resistance. This exposed the stock to negative pressure as it attempts to take profits from its previous gains and relieve part of its clear overbought condition on the Stochastic indicators, allowing it to rebuild positive momentum that could help it recover and overcome its negative pressures in the near term.
MoreHumana price volatile near pivotal resistance - Forecast today - 01-06-2026
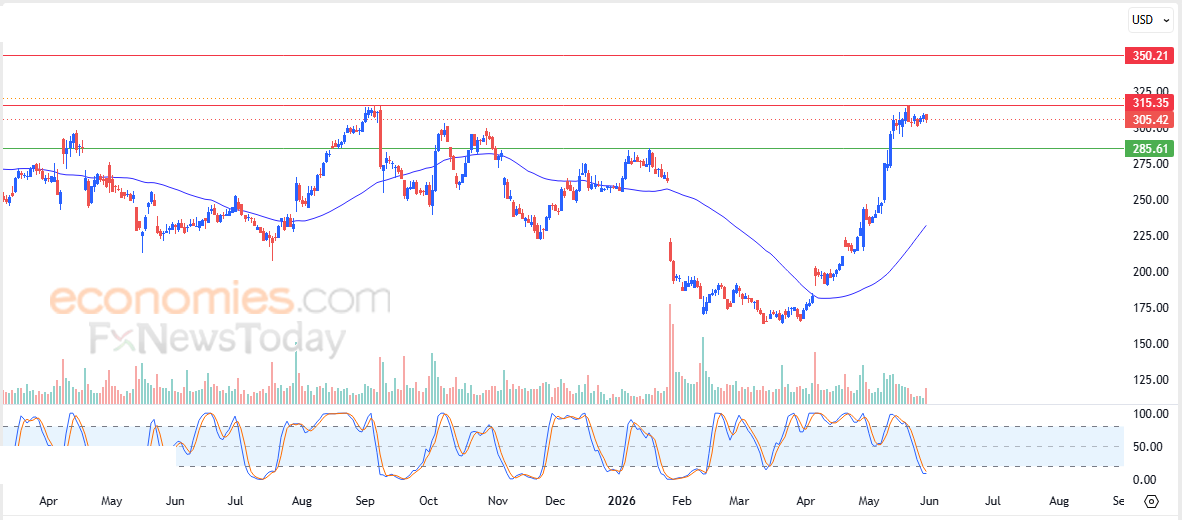
Humana Inc. (HUM) stock price witnessed volatile trading in its latest intraday movement, as the stock attempts to gain positive momentum that could help it break above the key resistance level at $315.15, supported by its continued trading above its 50-day SMA, which serves as a dynamic support base reinforcing the strength and stability of the short-term bullish trend. In addition, the Stochastic indicators have reached deeply oversold levels in an exaggerated manner compared to the stock’s movement, suggesting the beginning of a positive divergence.
MoreGeneral Electric price shows a spike in trading volumes - Forecast today - 01-06-2026
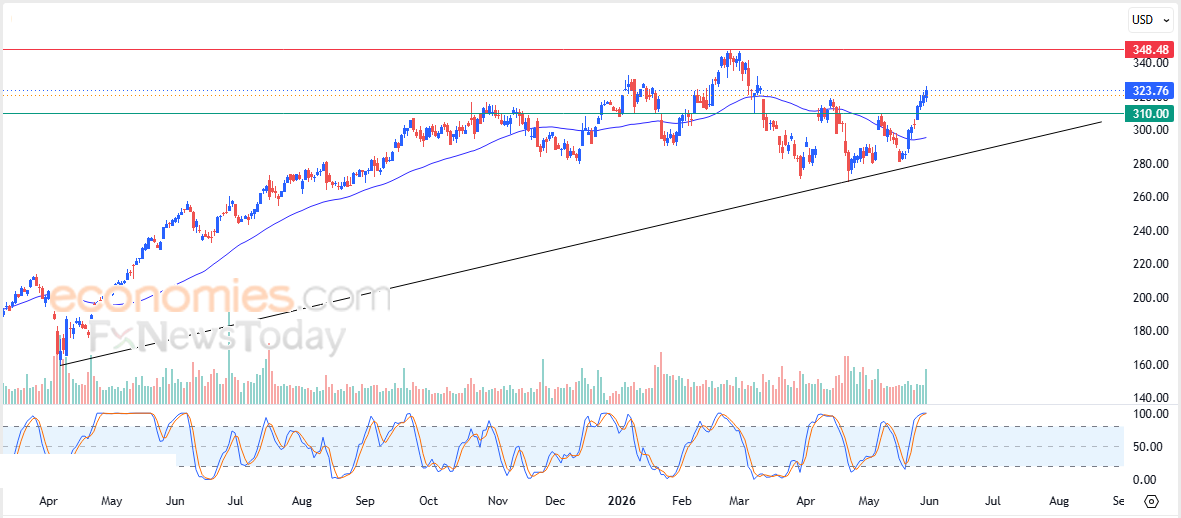
General Electric Company (GE) stock price extended its gains in its latest intraday trading, with the latest advance supported by a noticeable increase in trading volume, providing a technical signal that confirms the validity of this positive trend. The stock continues to benefit from dynamic support by trading above its 50-day SMA, which strengthens the chances of extending its gains in the near term. However, on the other hand, we notice the beginning of a negative crossover on the Stochastic indicators after reaching deeply overbought levels, which could temporarily limit further upside.
More