


 |
Solana price bumps into SMA resistance - Analysis - 25-02-2026
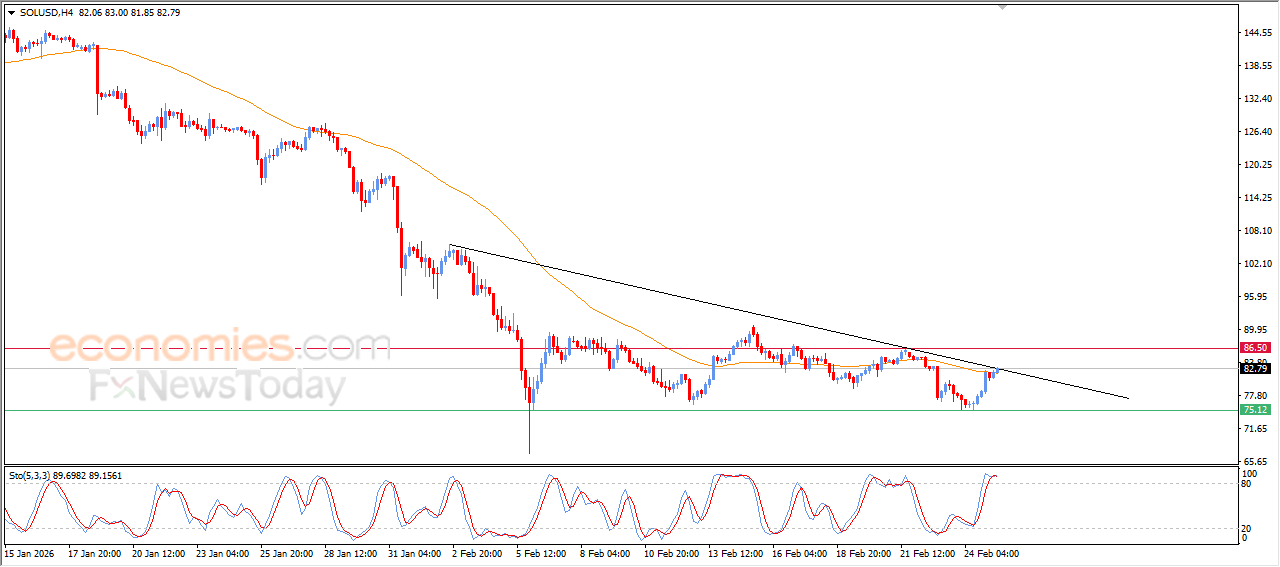
Solana (SOLUSD) price recorded strong gains in its latest intraday trading, but this rise has brought the price into direct contact with resistance at its 50-day SMA, coinciding with the test of a short-term minor bearish trendline. This increases the importance of this area as a key resistance zone that could determine the next price direction in the near term. In the background, the Stochastic indicator shows the beginning of a negative divergence after reaching extremely overbought levels relative to price action, accompanied by the emergence of a negative crossover.
Therefore we expect the cryptocurrency price to decline during its upcoming intraday trading sessions, as long as resistance at $86.50 remains intact, targeting the support level at $75.00.
Today’s price forecast: Bearish
Thanks for your feedback.
International Seaways price soars - Forecast today - 25-02-2026
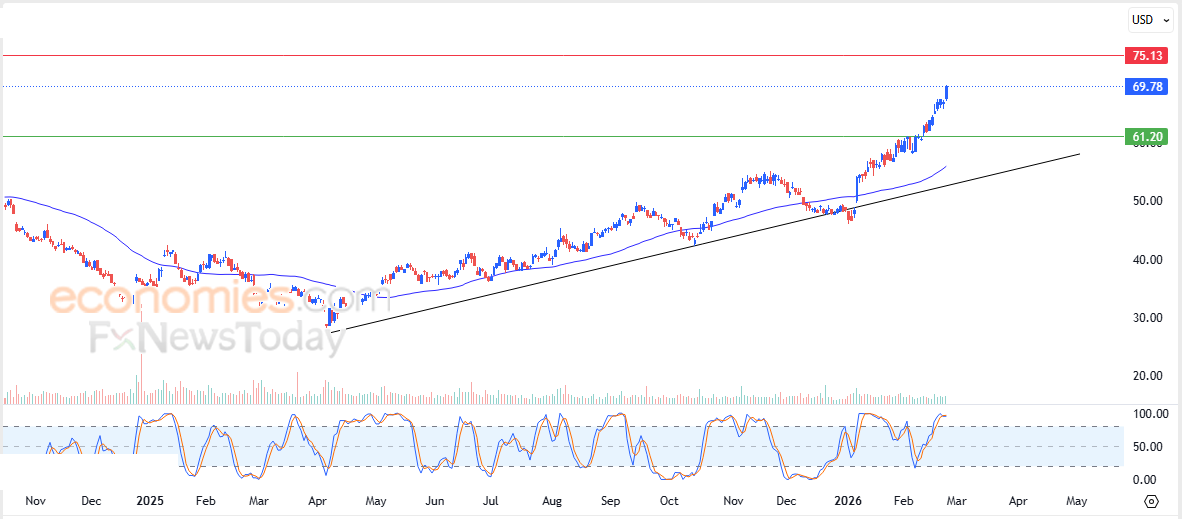
International Seaways, Inc. (INSW) stock price recorded continued gains in its latest intraday trading, amid full dominance of the main medium-term bullish trend, with price moving alongside a supporting trendline. The stock also benefits from continued trading above its 50-day SMA. However, the Stochastic indicator has begun to show a negative crossover after reaching extremely overbought levels, which may limit some of the upcoming gains.
MoreRevolve price trapped in a hesitant place - Forecast today - 25-02-2026
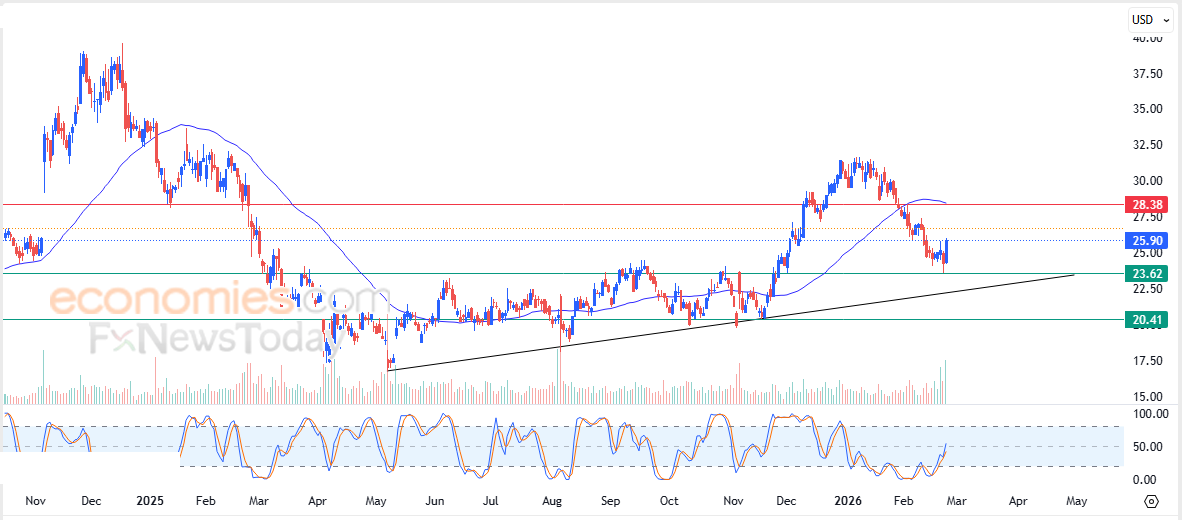
Revolve Group (RVLV) stock price recorded a strong jump in its latest intraday trading, accompanied by a noticeable increase in trading volumes and supported by positive signals from the Stochastic indicator. This comes amid the dominance of a medium-term bullish trend, with price moving alongside a supporting trendline. However, the stock still faces negative dynamic pressure as it continues to trade below its 50-day SMA.
MoreToast price tries to recoup some losses - Forecast today - 25-02-2026
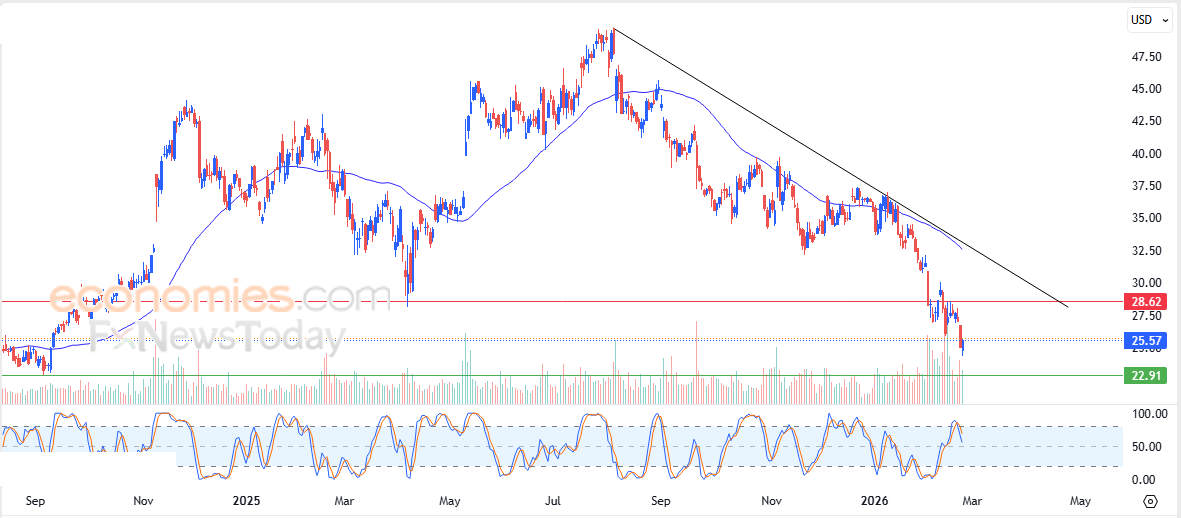
Toast (TOST) stock price recorded slight gains in its latest intraday trading, as the stock attempts to recover part of its previous losses. However, negative pressure remains in place as it continues to trade below its 50-day SMA, under the dominance of a short-term bearish trend while moving alongside a trendline supporting this path. In the background, the Stochastic indicator shows the early formation of a negative divergence after reaching extremely overbought levels, accompanied by emerging negative signals.
More