Ripple shakes off negative pressure - Analysis - 04-03-2026
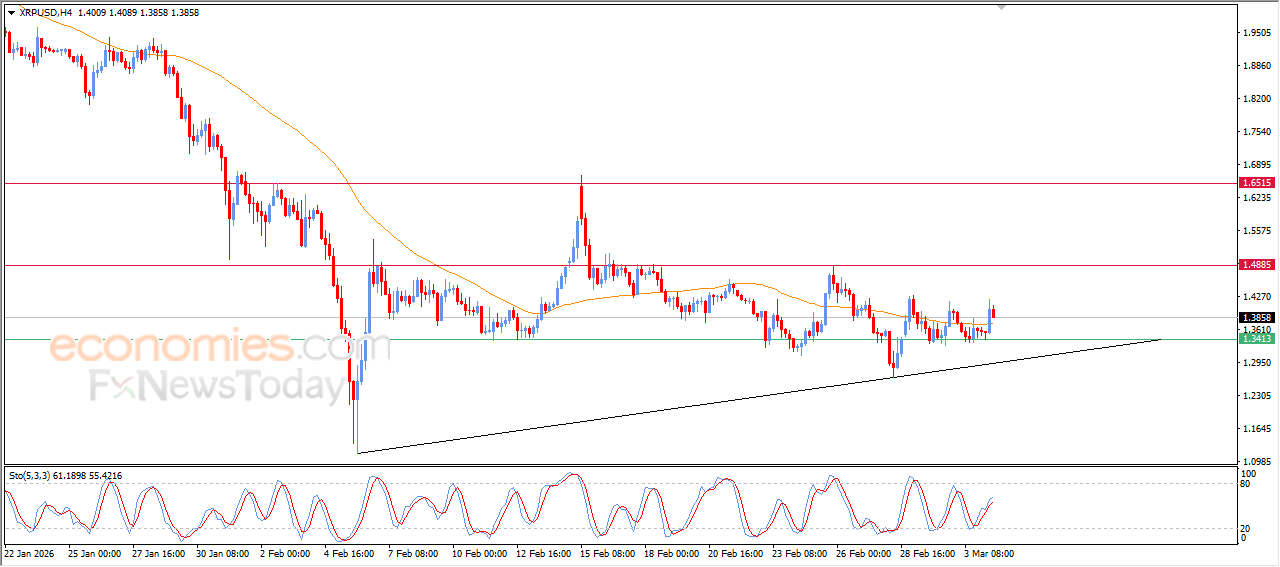
Ripple (XRPUSD) price recorded strong gains in its latest intraday trading, amid the dominance of a short-term corrective bullish trend, with continued dynamic support represented by trading above its 50-day SMA. The price has also managed to overcome the negative pressure from this moving average, reinforcing the chances of extending its gains in the near term.
Therefore we expect the cryptocurrency price to rise during its upcoming intraday trading sessions, as long as it remains stable above the support level at $1.3410, targeting the key resistance level at $1.4885.
Today’s price forecast: Bullish
Forecast update for Bitcoin -04-03-2026
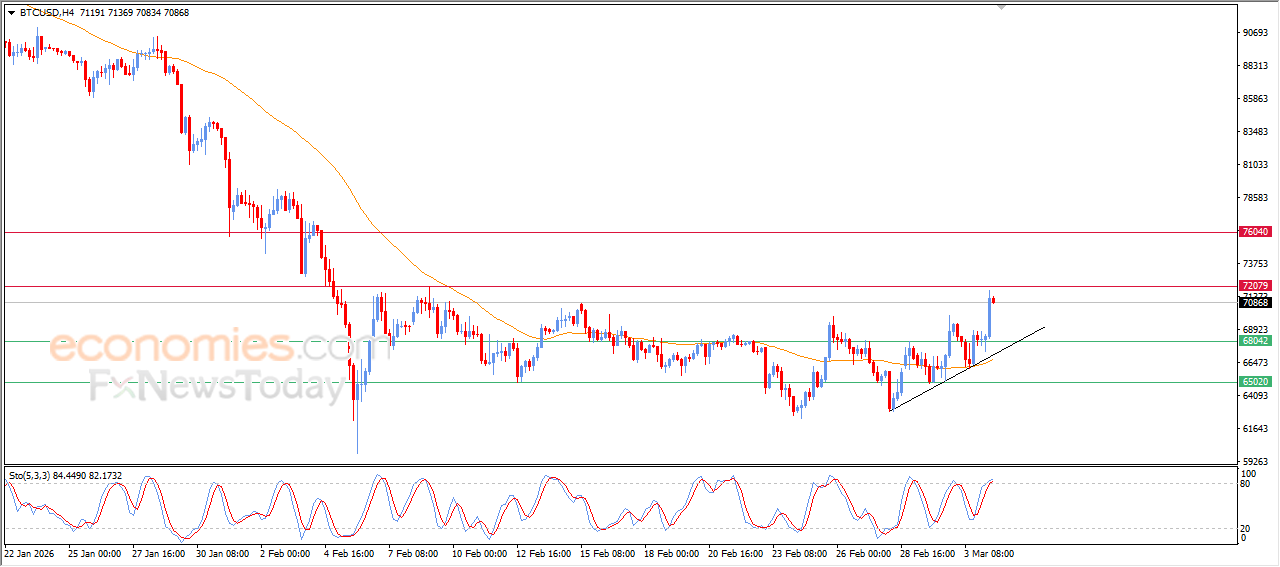
BTCUSD price surged higher in its last intraday trading, getting ready to attack $72,000 key resistance, which represented a target in our previous analysis, supported by its continued trading above EMA50, reinforcing the strength of short-term bullish corrective wave, with its trading alongside supportive trend line, besides the emergence of the positive signals from relative strength indicators, despite reaching overbought levels.
Forecast update for crude oil -04-03-2026
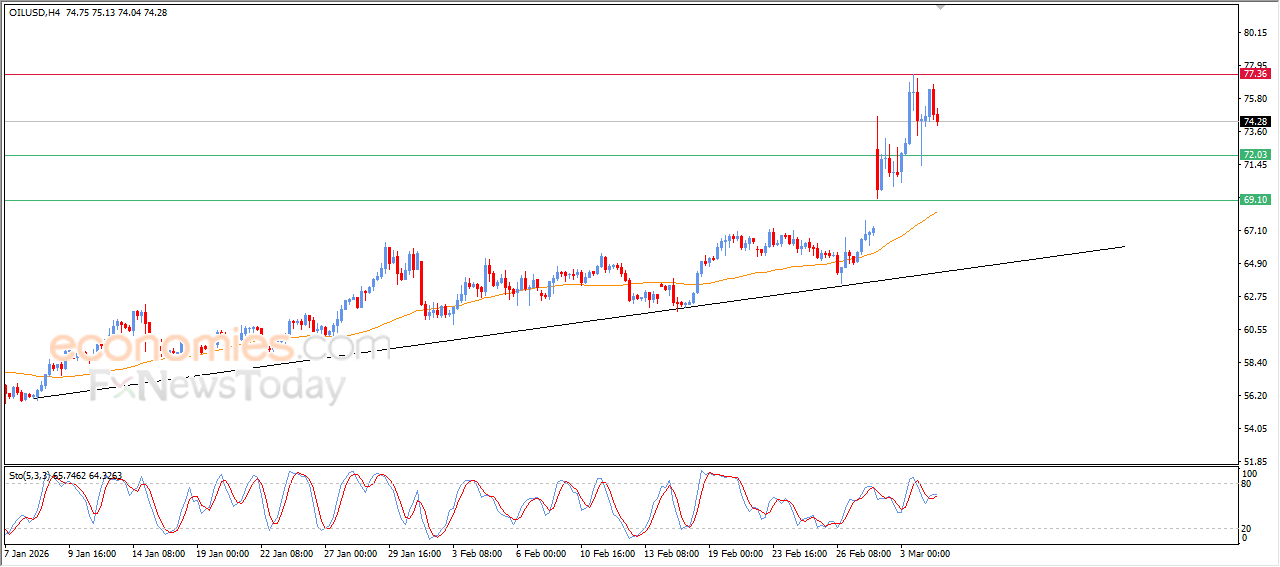
The price of (crude oil) declined in its last trading on the intraday basis, amid its attempts to gain bullish momentum that might help it to recover and rise again, amid the dominance of the main bullish trend on short-term basis, with its trading above EMA50, reinforcing the chances of its recovery in near-term basis, especially with the emergence of overbought conditions, opening the way for targeting new resistance levels.
Forecast update for silver -04-03-2026
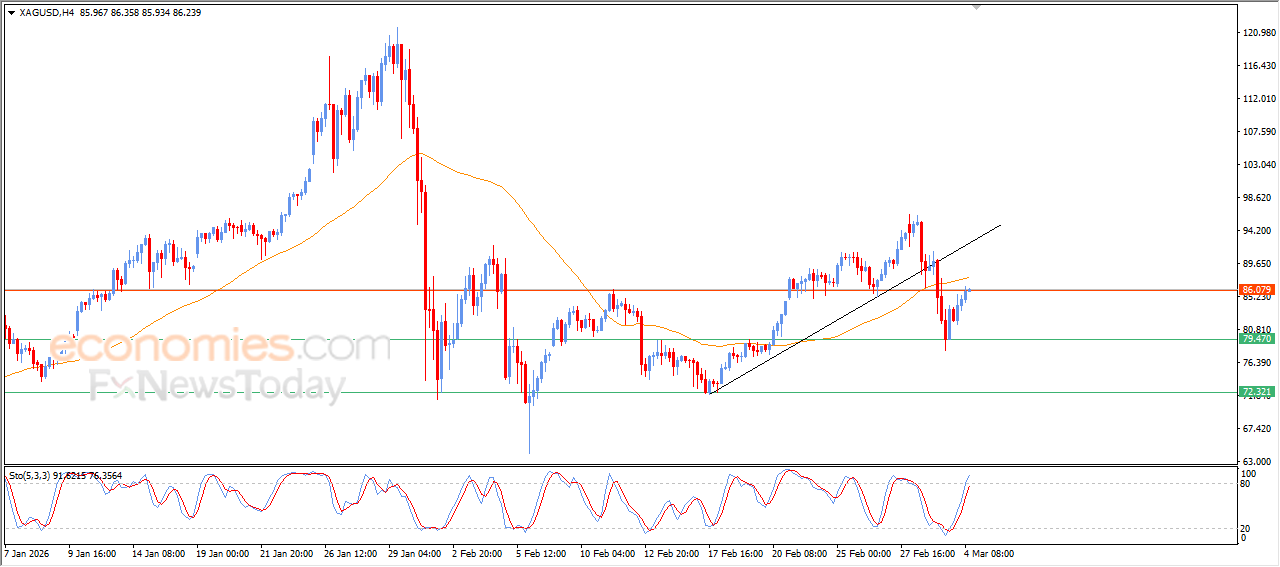
The price of (silver) rose in its last trading, supported by the emergence of the positive signals from relative strength indicators, to retest $86.00 resistance, amid the effect of breaking minor bullish trend line on short-term basis, and there is negative and dynamic pressure that is represented by its trading below EMA50, and the relative strength indicators reached overbought levels, exaggeratedly compared to the price move, to indicate begin forming negative divergence.