


 |
|
Ripple gives in to negative pressure - Analysis - 27-07-2026
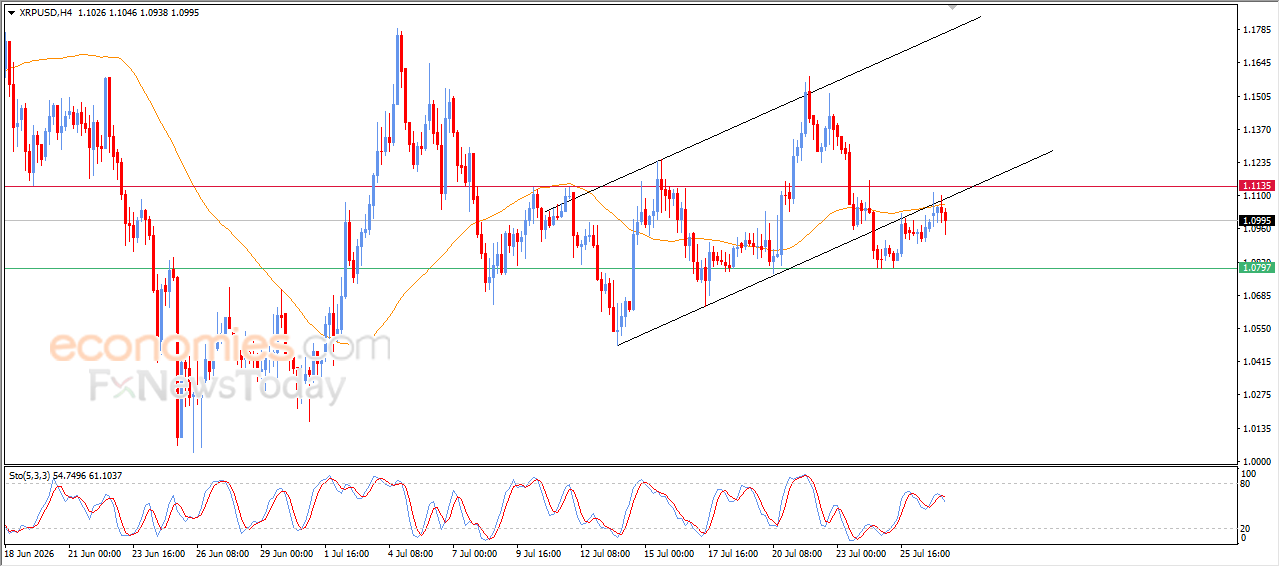
XRP (XRPUSD) moved lower in recent intraday trading after encountering resistance at its 50-period Simple Moving Average (SMA), which has reinforced the prevailing downside pressure. This negative bias has been further strengthened by fresh bearish signals from momentum indicators after they reached overbought territory. The cryptocurrency has also come under pressure following its breakout below a short-term ascending price channel that had previously contained its upward movement, increasing the likelihood of further losses in the near term.
Therefore, our outlook remains bearish for the cryptocurrency's upcoming trading sessions, as long as resistance at $1.1135 remains intact. Under this scenario, the price is expected to target the key support level at $1.0800.
Today's price forecast: Bearish.
Affirm price keeps falling - Forecast today - 27-07-2026
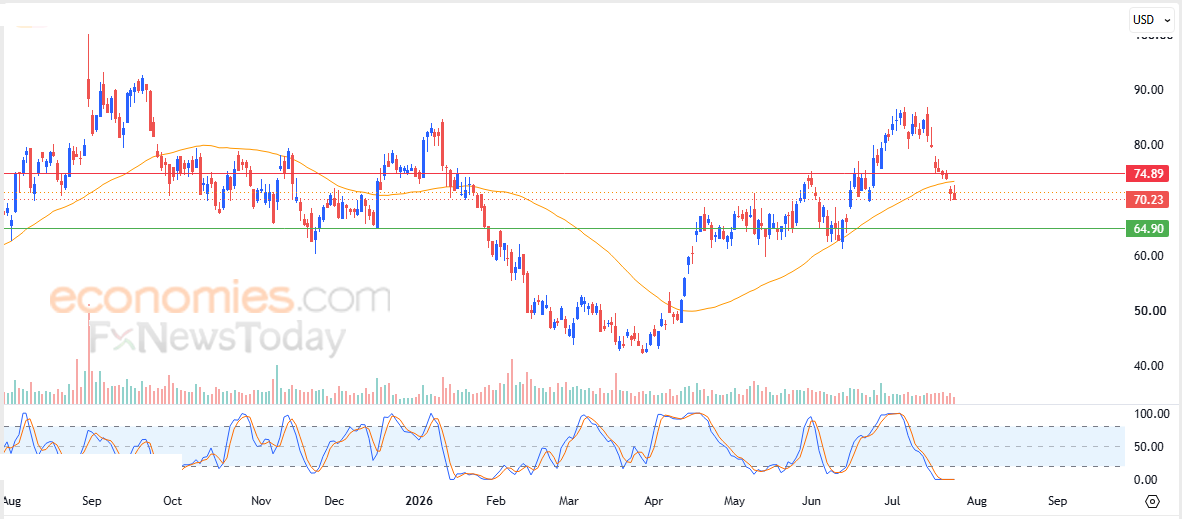
Affirm Holdings (AFRM) continued to decline in recent intraday trading after falling below its 50-day Simple Moving Average (SMA), losing a key support level that has intensified the negative pressure surrounding the stock. The stock remains under the control of a steep short-term bearish trend, while momentum indicators continue to generate bearish signals despite remaining in extremely oversold territory, suggesting that downside momentum remains firmly intact.
Therefore, our outlook remains bearish for the stock's upcoming trading sessions, as long as it remains below resistance at $74.90. Under this scenario, the stock is expected to target its next support level at $64.90.
Today's price forecast: Bearish.
Agilent Technologies price driven lower by important resistance - Forecast today - 27-07-2026
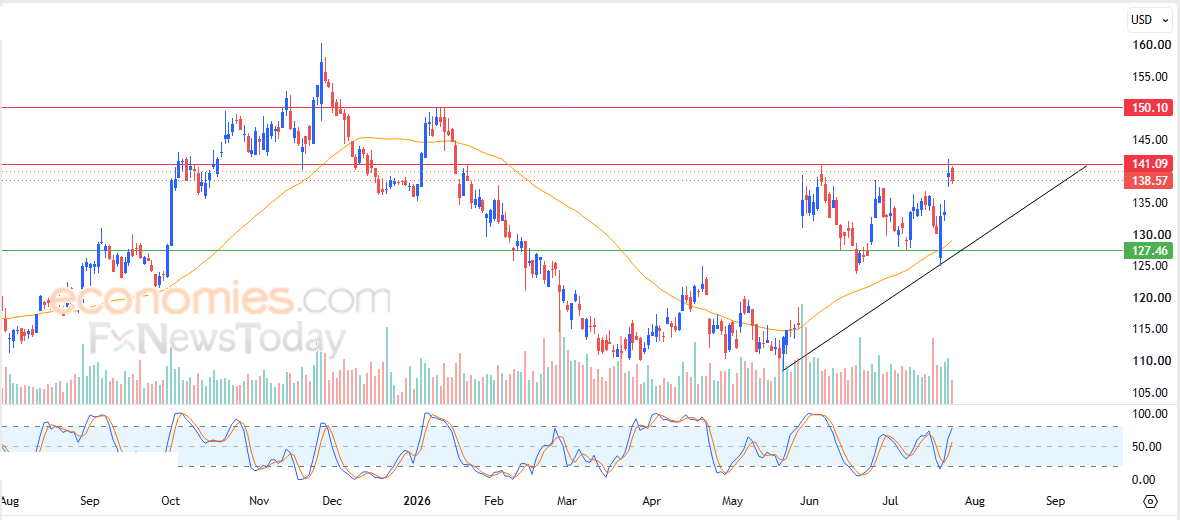
Agilent Technologies, Inc. (A) moved lower in recent intraday trading after once again holding below the key resistance level at $141.00, as the stock underwent a bout of profit-taking following its recent gains while attempting to rebuild positive momentum for another breakout attempt. Despite the pullback, the stock remains within a short-term bullish corrective trend, with price action continuing to move alongside an ascending trendline that reinforces the prevailing positive bias. In addition, the stock continues to trade above its 50-day Simple Moving Average (SMA), which is acting as dynamic support, while momentum indicators continue to generate fresh bullish signals.
Therefore, our outlook remains bullish for the stock's upcoming trading sessions, particularly if it breaks above the key resistance level at $141.00. Under this scenario, the stock is expected to target the next resistance level at $150.00.
Today's price forecast: Bullish.
Qualcomm price shows more negative signals - Forecast today - 27-07-2026
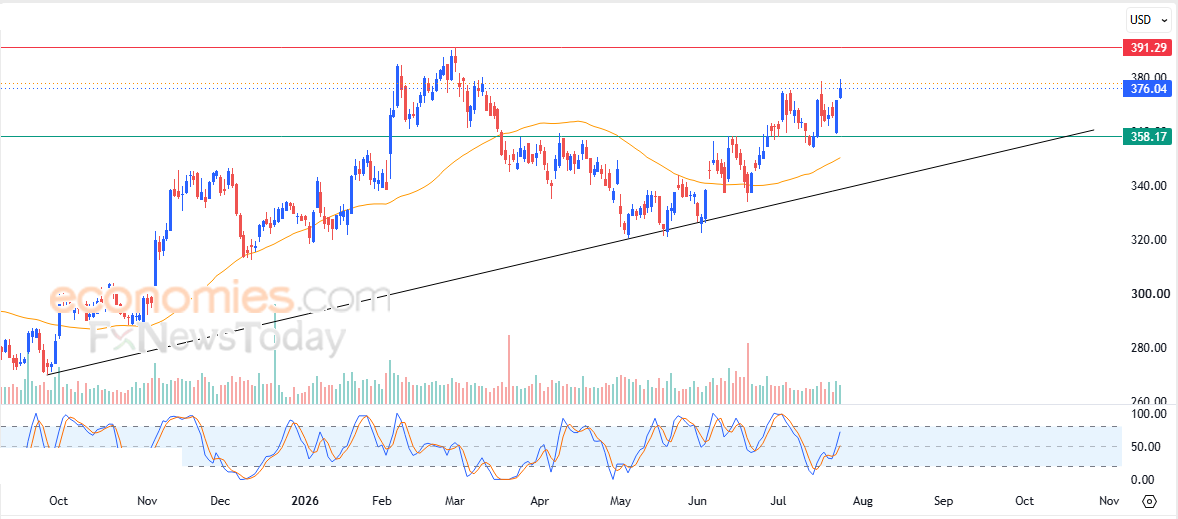
Qualcomm Incorporated (QCOM) moved lower in recent intraday trading as the stock remained under the control of a short-term bearish corrective trend, with price action continuing to follow a steep descending trendline that reinforces the prevailing downside bias. Selling pressure also persists as the stock continues to trade below its 50-day Simple Moving Average (SMA), limiting the prospects for a sustained recovery in the near term. Meanwhile, momentum indicators have started generating fresh bearish signals after successfully easing their oversold conditions, leaving the stock with additional room to extend its recent losses.
Therefore, our outlook remains bearish for the stock's upcoming trading sessions, as long as resistance at $184.00 remains intact. Under this scenario, the stock is expected to target its first support level at $158.85.
Today's price forecast: Bearish.