Litecoin price faces negative outlook - Analysis - 03-11-2025
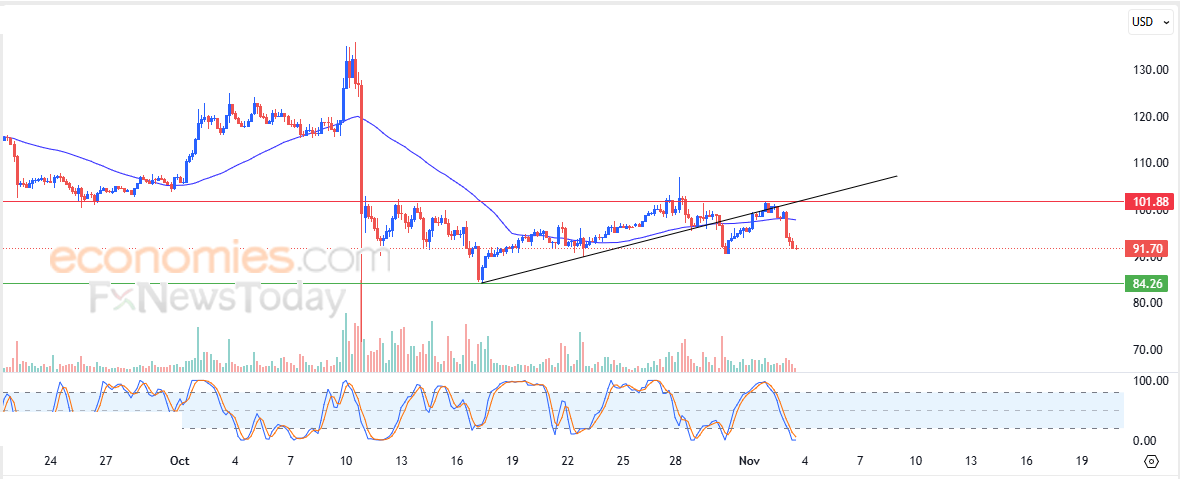
Litecoin (LTCUSD) continued to decline in its latest intraday trading after previously breaking a short-term corrective upward trend line. Ongoing negative pressure persists from trading below the 50-day SMA, which adds to the overall bearish momentum surrounding the cryptocurrency. This is further supported by negative signals from the relative strength indicators, despite reaching extremely oversold levels.
Therefore, we expect the cryptocurrency to decline in its upcoming intraday trading as long as the resistance level of $101.85 holds, targeting the key support level of $84.25.
Today’s price forecast: Bearish.
Amazon price pierces pivotal resistance - Forecast today - 03-11-2025
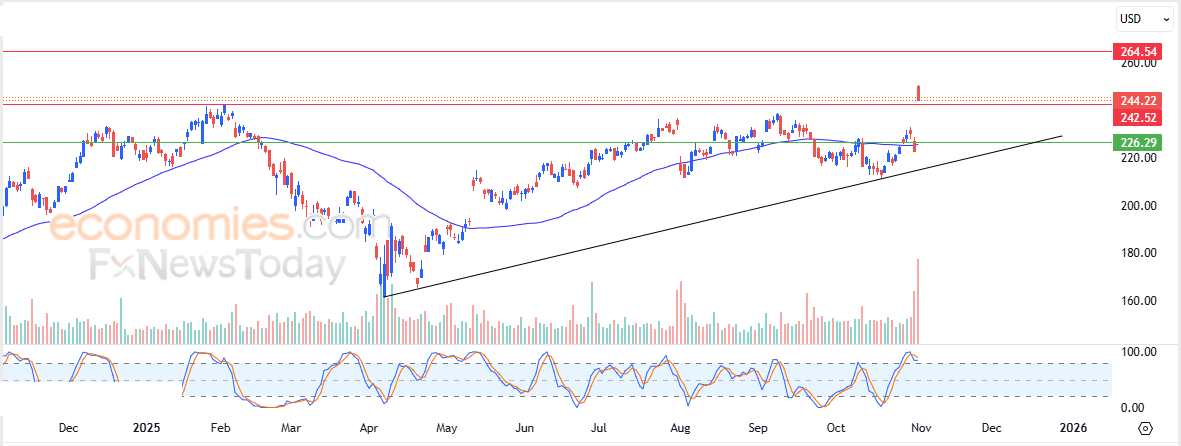
Amazon.com, Inc (AMZN) stock jumped higher in its latest intraday trading, successfully breaking through the key resistance level of $242.50. This move was accompanied by a sharp increase in trading volumes, confirming the validity of the breakout from a technical standpoint. The rise also helped the stock overcome the negative pressure of the previous 50-day SMA, even as negative signals began to appear from the relative strength indicators after reaching extremely overbought levels.
MoreAT&T price returns higher - Forecast today - 03-11-2025
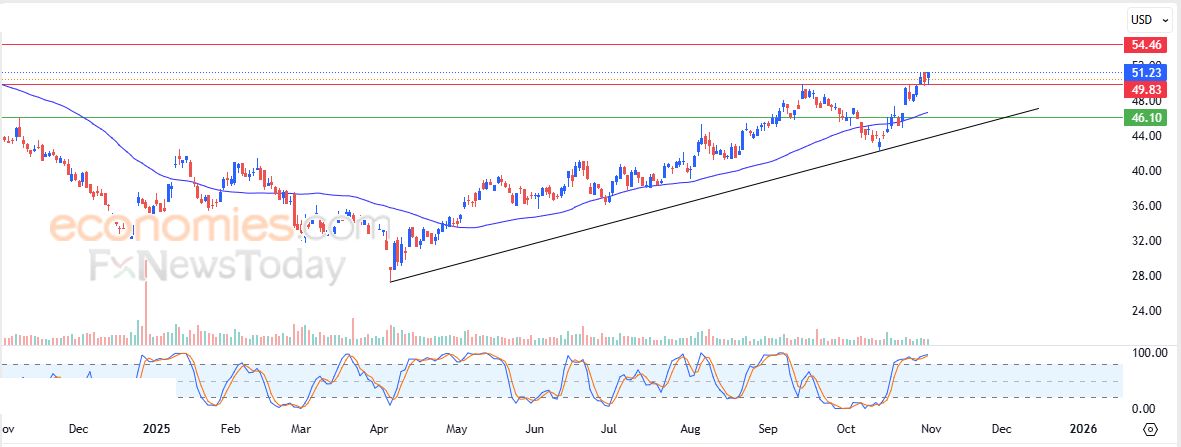
International Seaways, Inc. (INSW) stock rose again in its latest intraday trading, confirming a breakout above the key resistance level of $49.80. The move is supported by continued trading above the previous 50-day SMA and under the dominance of the main short-term bullish trend, with trading along an ascending line that reinforces this direction. In addition, positive signals are appearing from the relative strength indicators, though they have reached extremely overbought levels, which may limit the stock’s upcoming gains.
MoreRevolve price tries to vent off overbought saturation - Forecast today - 03-11-2025
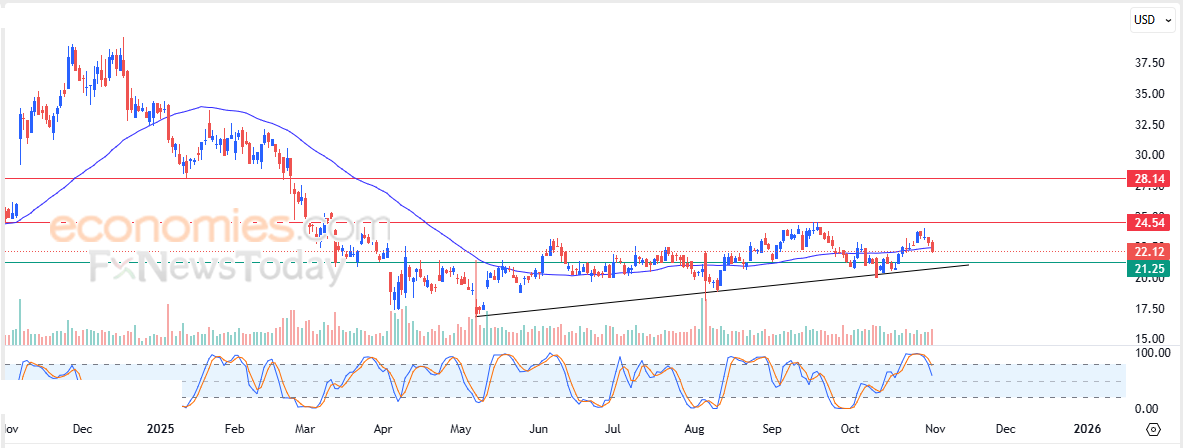
Revolve Group (RVLV) stock declined in its latest intraday trading as it attempts to gain positive momentum that could help it recover and rise again. At the same time, the stock is working off part of its overbought levels on the relative strength indicators, where negative signals have started to appear. The decline found support at the previous 50-day SMA, while the stock remains under the dominance of a short-term corrective bullish trend, with trading along an ascending line.
More