Litecoin moves in a tight range - Analysis - 18-02-2026
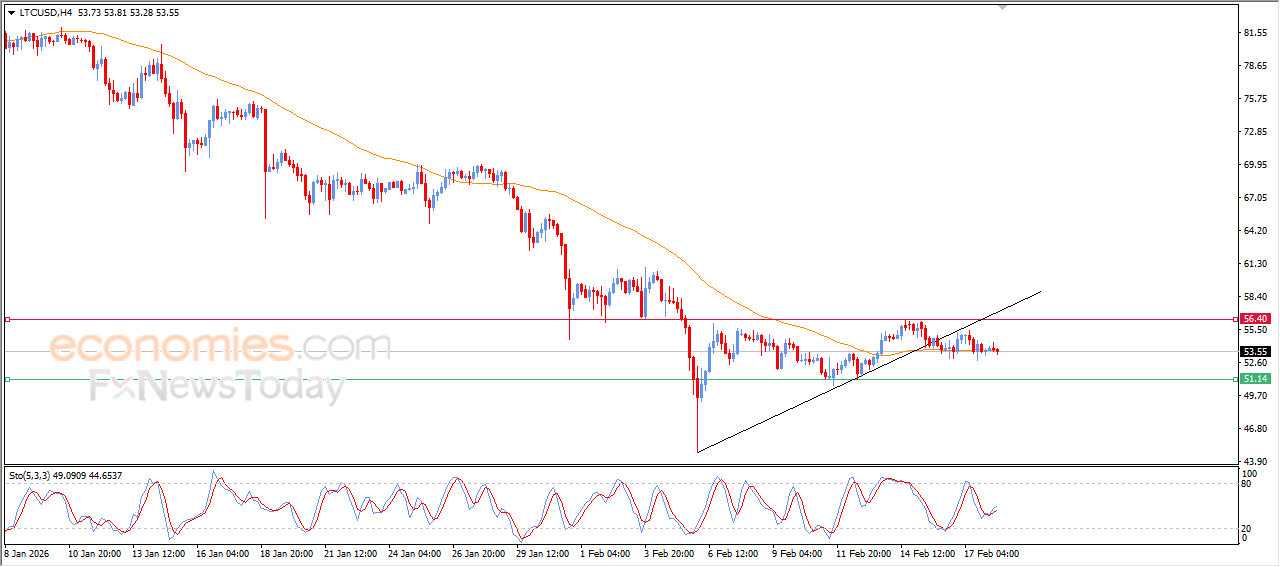
Litecoin (LTCUSD) price recorded sideways trading within a narrow range in its latest intraday sessions, stabilizing around support from its 50-period SMA, signaling an attempt to build positive momentum that could help it rise, especially with the beginning of positive signals emerging from momentum indicators. However, the main bearish trend remains dominant on the short term, as the price is still affected by breaking a corrective ascending trend line.
Therefore, our outlook remains neutral for the cryptocurrency’s upcoming intraday trading. As long as it remains below the $56.40 resistance level, expectations lean toward further decline, targeting the $51.00 support level.
Today’s price forecast: Neutral
Evening update for Bitcoin -18-02-2026
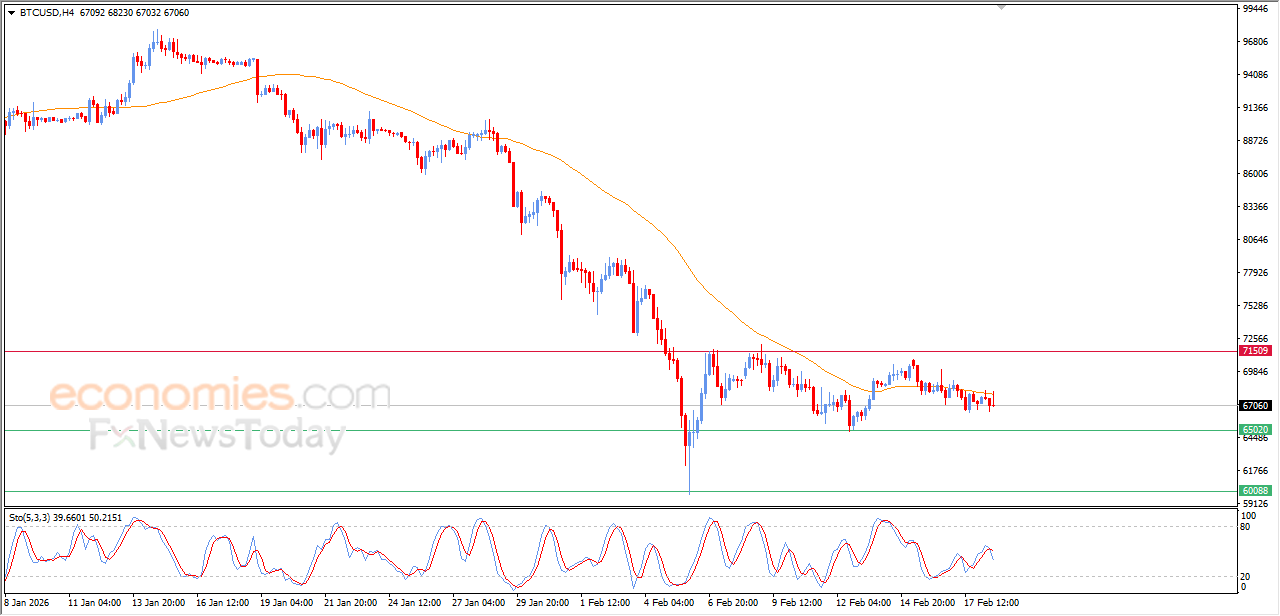
The (BTCUSD) price continues its fluctuating trading on its last intraday levels, with the emergence of negative signals from relative strength indicators, under the dominance of the main bearish trend on short-term basis, and the price is under negative pressure due to its trading below EMA50, reinforcing the likelihoods of the price decline on near-term basis.
Evening update for crude oil -18-02-2026
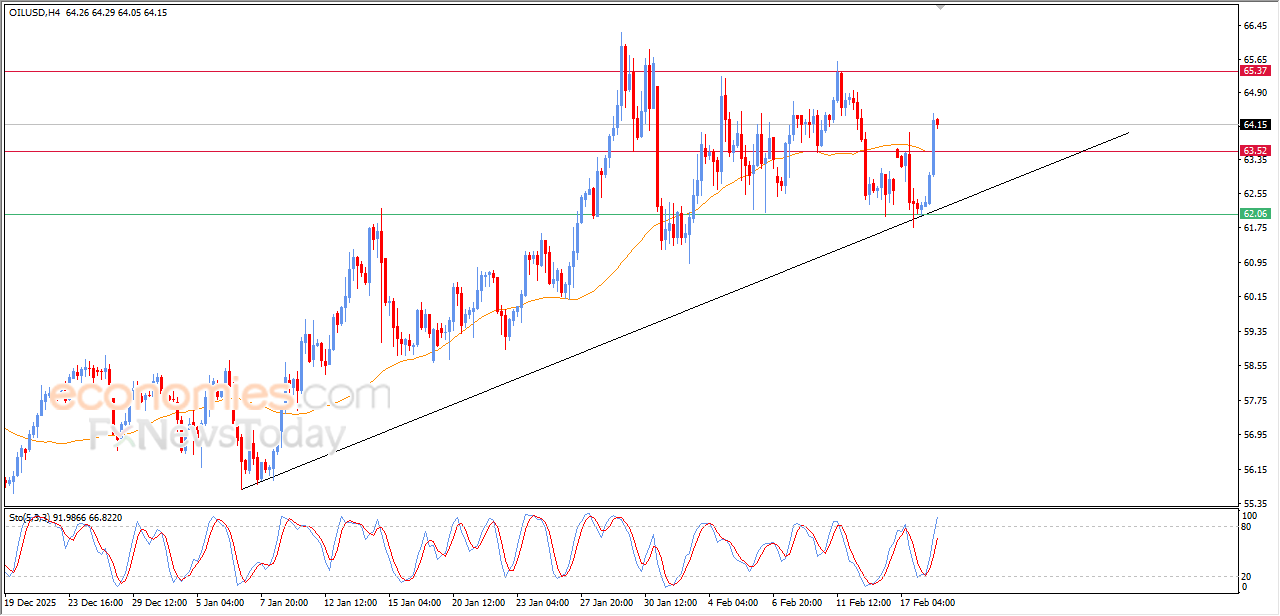
The (crude oil) price surged higher in its last intraday trading, supported by the emergence of positive signals from relative strength indicators, surpassing the resistance of EMA50, to surpass its negative pressure to turn our bearish scenario into bullish scenario, with the dominance of the main bullish trend on short-term basis.
Evening update for gold -18-02-2026
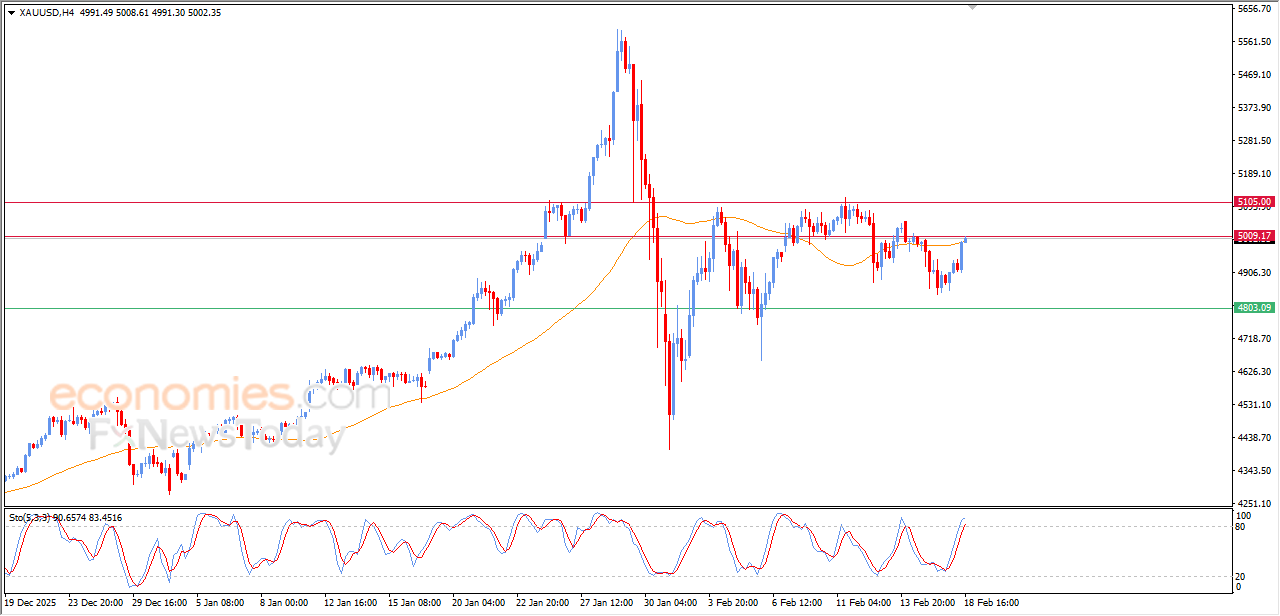
Gold price witnessed strong gains on its last intraday levels, to reach the resistance of EMA50, accompanied by testing psychological main resistance at $5,000, therefore the negative pressures remain on the price, especially with the relative strength indicators reaching overbought levels, exaggeratedly compared to the price move.