Forecast update for Ethereum -13-01-2026
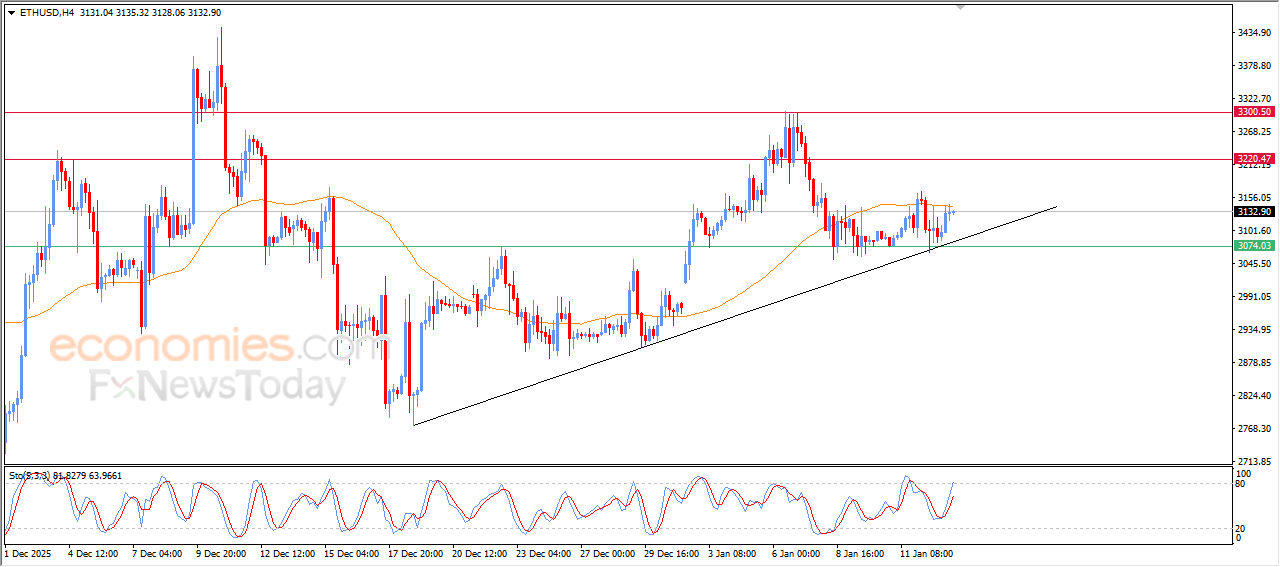
The price of (ETHUSD) settles on gains in its last intraday trading, supported by the emergence of the positive signals on the relative strength indicators, under the dominance of the bullish trend on the short-term basis, and its trading alongside supportive trend line for this trend, attempting to get rid of the negative pressure of EMA50, announcing its recovery and extending its intraday gains.
Forecast update for brent crude oil -13-01-2026
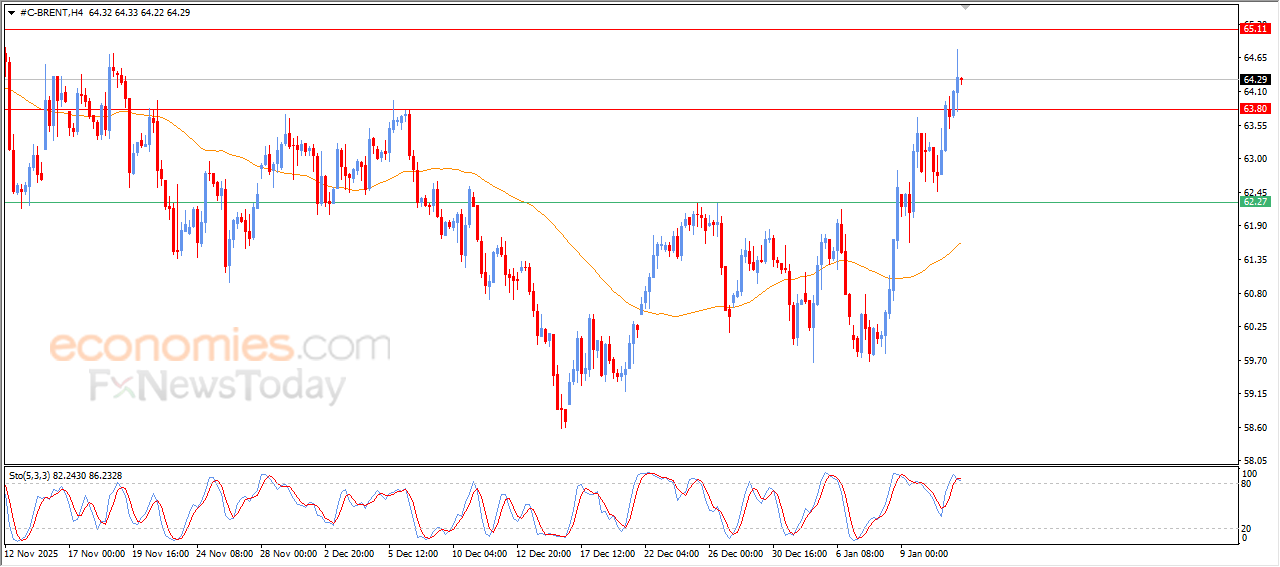
Brent crude oil’s prices kept rising in its last intraday trading, to breach $63.80 resistance, which was an expected target in our previous analysis, supported by its continuous trading above EMA50, reinforcing the stability and strength of the bullish track on the short-term basis, on the other hand, we notice the emergence of negative overlapping signals from the relative strength indicators, after reaching overbought levels, which might reduce the upcoming gains.
Forecast update for Bitcoin -13-01-2026
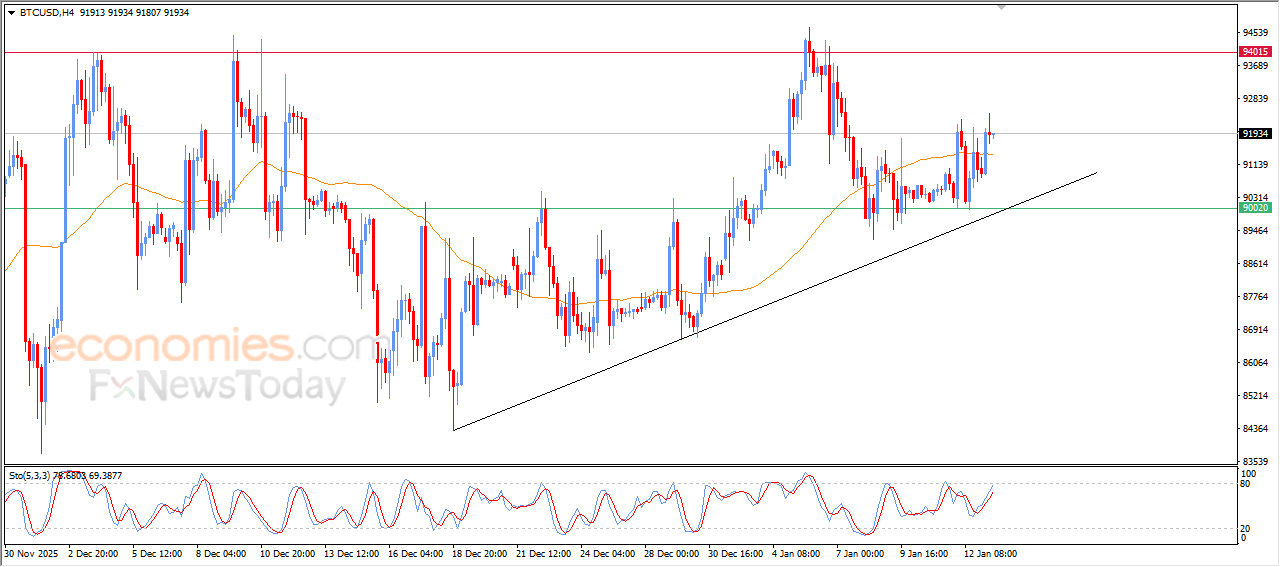
BTCUSD’s price settles with strong gains in its recent intraday trading, surpassing the negative pressure of EMA50, which prevented the price recovery previously, amid the dominance of the bullish trend on the short-term basis, with its trading alongside supportive trend line for this trend, besides the emergence of the positive signals from the relative strength indicators, reinforcing the chances of extending the gains on the near-term basis.
Forecast update for crude oil -13-01-2026
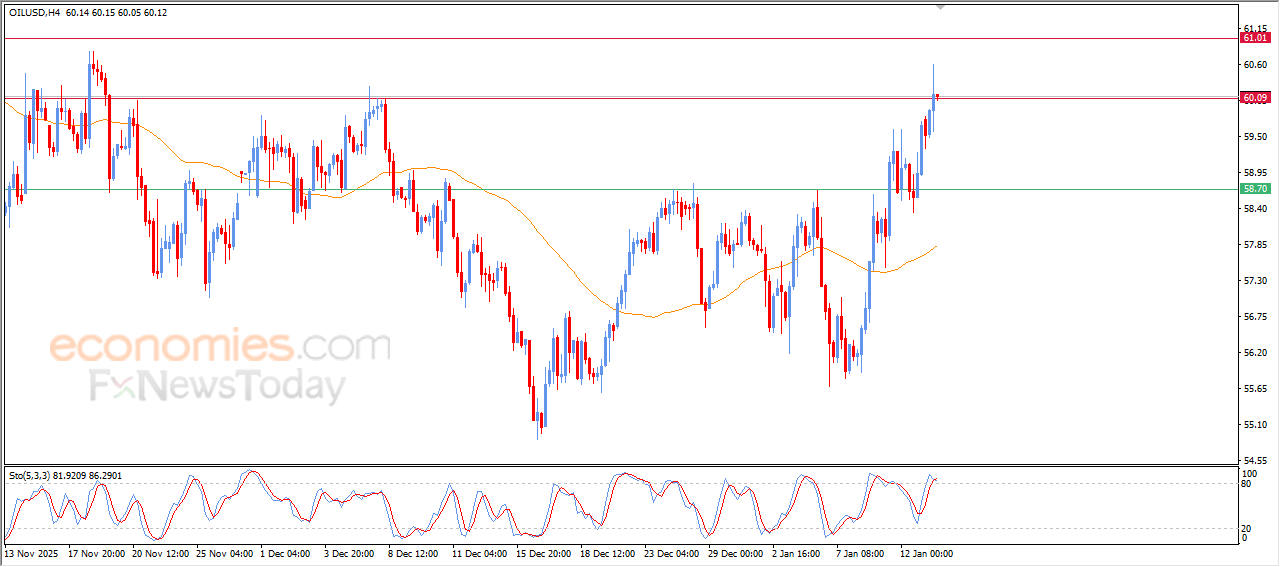
The price of (crude oil) rose in its last trading on the intraday levels, reaching $60.00 resistance level, which represents our expected target in our previous analysis, supported by the dominance of strong bullish wave on the short-term basis, with the continuation of the dynamic pressure that is represented by its trading above EMA50, on the other hand, we notice the beginning of negative overlapping signals on the relative strength indicators, after reaching overbought levels, which might reduce the upcoming gains.