Forecast update for Bitcoin -30-04-2026
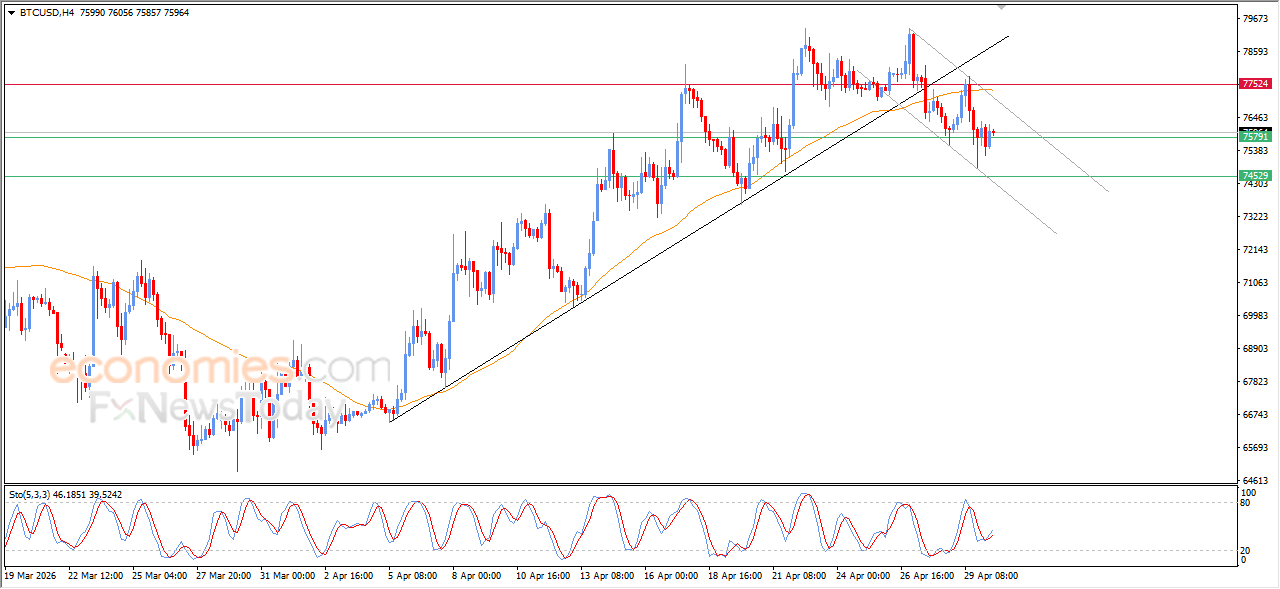
Bitcoin (BTCUSD) settles with limited gains during its recent intraday trading, benefiting from the emergence of the positive signals from the relative strength indicators, to form positive divergence that might push it for more positive rebounds, targeting the attempt of recovering some of its previous losses, amid the continuation of the negative and dynamic pressure that is represented by its trading below EMA50, reducing the chances of a full recovery on the near-term basis, especially with the dominance of bearish corrective wave on short-term basis.
Forecast update for crude oil -30-04-2026
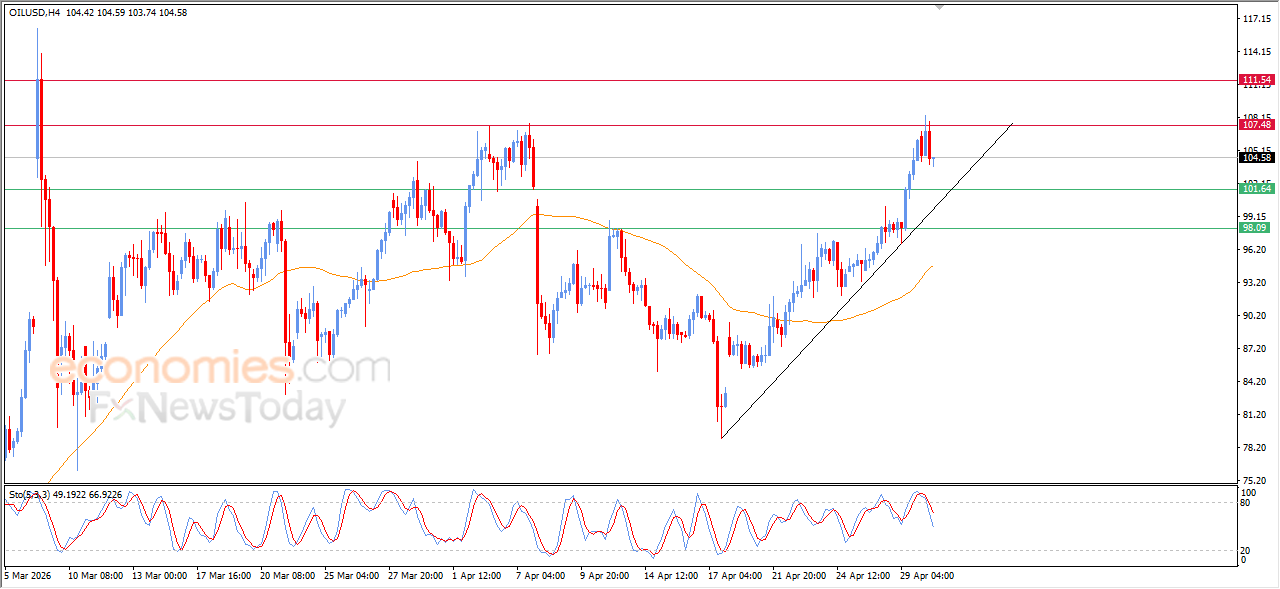
Crude oil declined during recent intraday trading, due to the stability of the key resistance level at $107.50, to gather the gains of its previous rises, attempting to look for higher low to take as a base that might help it to gain the required bullish momentum for its recovery and rise again, attempting to offload its overbought conditions on the relative strength indicators, especially with the emergence of negative signals from them, amid the dominance of the bullish trend on short-term basis, with its trading alongside supportive trend line for this path.
Forecast update for silver -30-04-2026
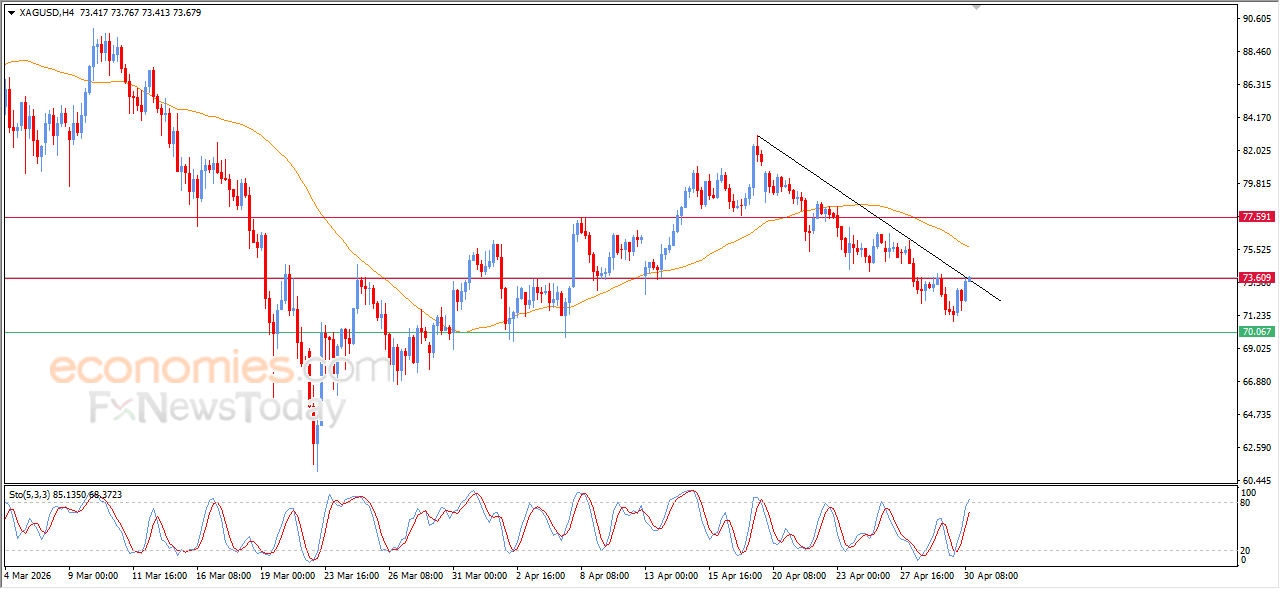
Silver rose during recent intraday trading, to retest the key resistance at $73.60, accompanied by testing minor bearish trend line on the short-term basis, intensifying the importance of this level in detecting the upcoming trend in the upcoming near period, amid the continuation of the negative pressure due to its trading below EMA50, with the relative strength indicators entering exaggerated overbought levels compared to the price move.
Forecast update for gold -30-04-2026.
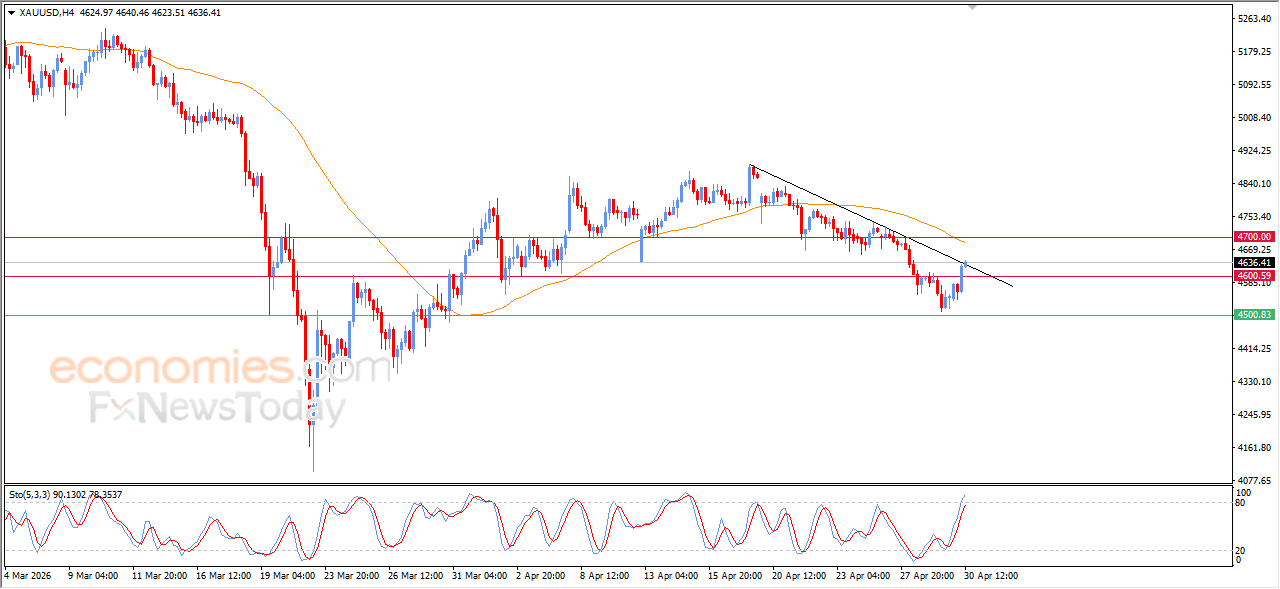
Gold witnessed strong gains in its recent intraday trading, supported by the emergence of positive signals from the relative strength indicators, to test minor bearish trend line on the short-term basis, with the relative strength indicators reaching overbought levels, exaggeratedly compared to the price move, indicating a quick lose for the positive momentum, especially with the continuation of the negative and dynamic pressure that is represented by its trading below EMA50, reducing the chances of a full recovery on the near-term basis.