Forecast update for Bitcoin -21-05-2026
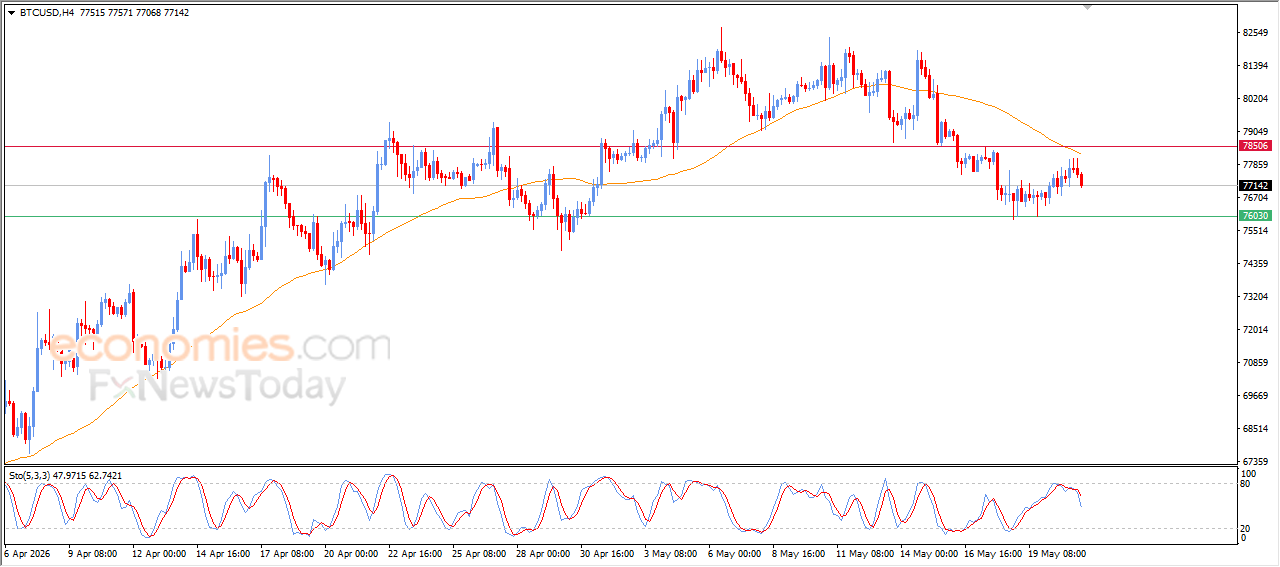
Bitcoin price declined during recent intraday trading, surpassing the negative pressure, which begin by the dominance of bearish corrective wave on the short-term basis, with a negative and dynamic pressure that is represented by its trading below EMA50, noticing the formation of negative divergence on the relative strength indicators, after reaching overbought levels, exaggeratedly compared to the price move, with the emergence of the negative signals from them, intensifying the pressure to suggest more downside moves in the near upcoming period.
Forecast update for crude oil -21-05-2026
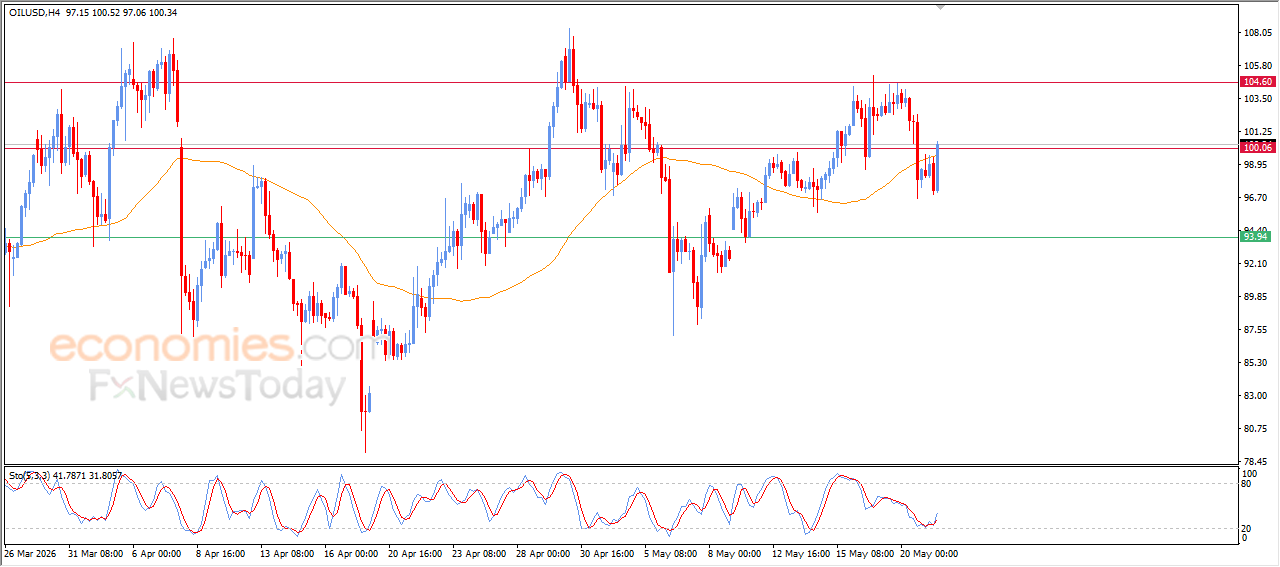
Crude Oil price surged higher during its recent intraday trading, with the emergence of the positive signals from the relative strength indicators, after reaching oversold levels, to surpass EMA50 resistance, as a clear signals for the positive momentum, which might help it to surpass its negative pressure and extend these gains in the upcoming near period.
Forecast update for silver-21-05-2026
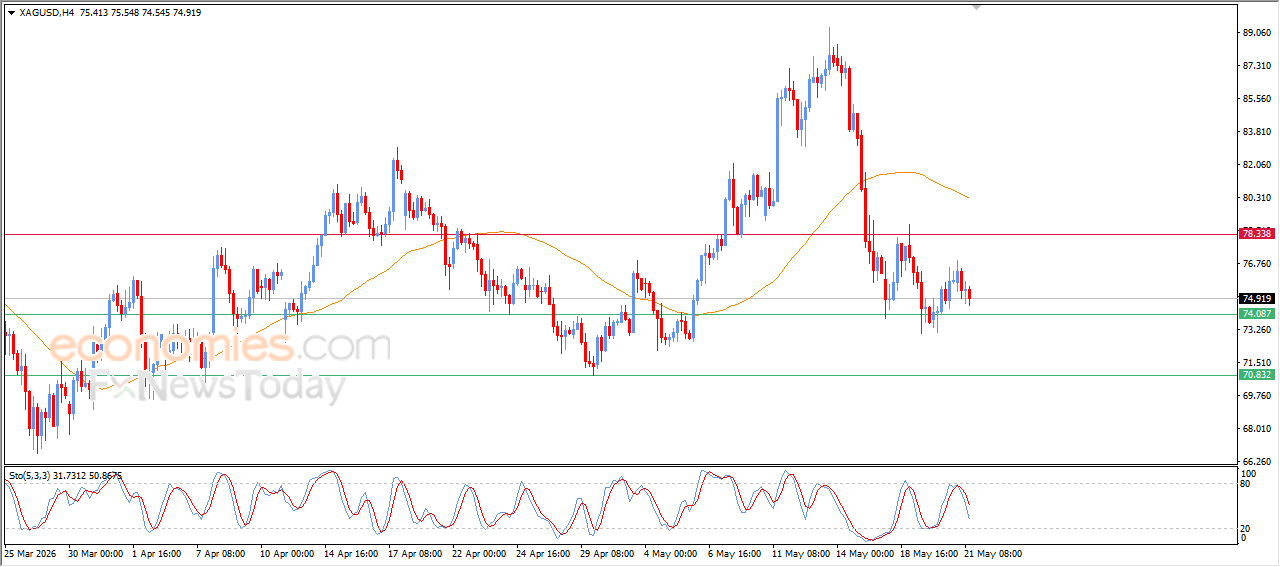
Silver price declined during its recent intraday trading, affected by the formation of a negative divergence on the relative strength indicators after reaching excessively overbought levels compared to price movement, alongside the emergence of negative signals from these indicators. This ended the price’s previous recovery attempts, amid the dominance of a steep short-term corrective bearish wave, while continued trading below the EMA50 maintains negative pressure on the price, further reinforcing the bearish outlook.
Forecast update for Gold -21-05-2026.
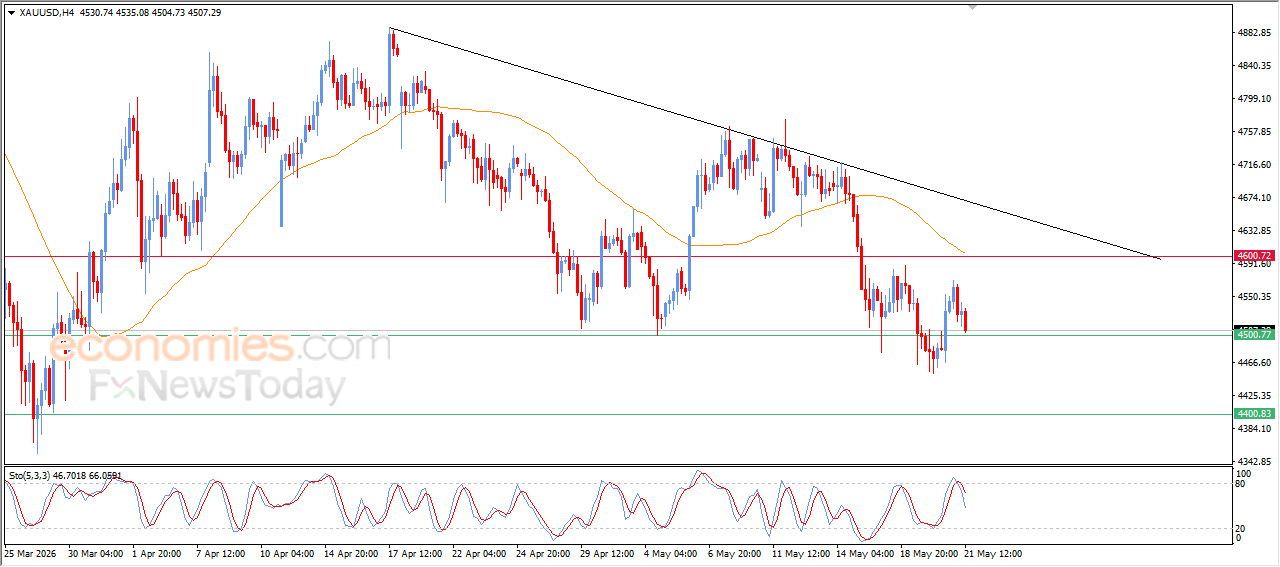
Gold price declined during its recent intraday trading, preparing to break below the $4,500 support level, as a negative divergence has formed on the relative strength indicators after reaching heavily overbought levels in an exaggerated manner compared to price movement, while negative signals continue to emerge from these indicators, increasing the negative pressure on price action. This occurs amid the dominance of the short-term corrective bearish trend, alongside continued negative pressure from trading below the EMA50, which reduces the chances of a near-term recovery.