Forecast update for Bitcoin -11-03-2026
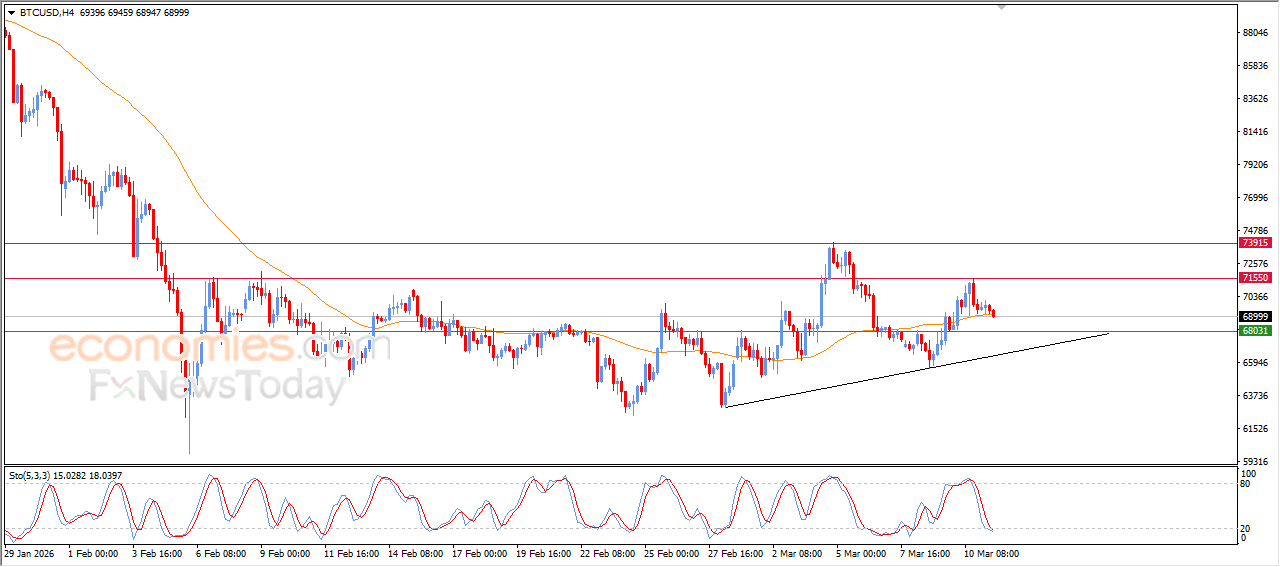
BTCUSD price declined in its last intraday trading, amid the emergence of the negative signals from relative strength indicators continuing its attempts to look for higher low to take it as a base that might help it to gain the required bullish momentum for its recovery, leaning on EMA50’s support until now, with the dominance of bullish corrective wave on short-term basis, and its trading alongside supportive trend line for this path.
Forecast update for crude oil -11-03-2026
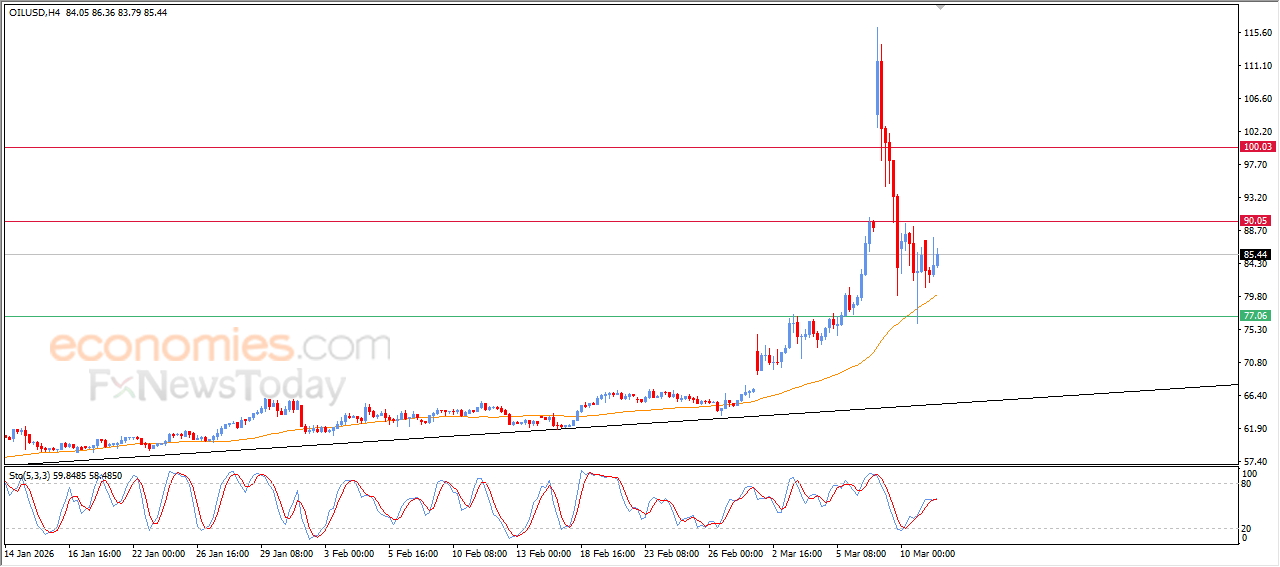
The price of (crude oil) rose in its last intraday trading, taking advantage of the continued dynamic support due to its trading above EMA50, reinforcing the stability and dominance of the main bullish trend on the short-term basis, noticing the emergence of the positive signals from relative strength indicators, after reaching oversold levels.
Forecast update for silver -11-03-2026

The price of (silver) declined in its last intraday trading, attempting to look for higher low to take it as a base that might help it to gain the required bullish momentum for its recovery, to lean on EMA50’s support, with the relative strength indicators’ reaching exaggerated oversold levels compared to the price move, to indicate the beginning of forming positive divergence, amid the dominance of the bullish corrective trend on short-term basis, with its trading alongside supportive trend line,
Forecast update for gold -11-03-2026.
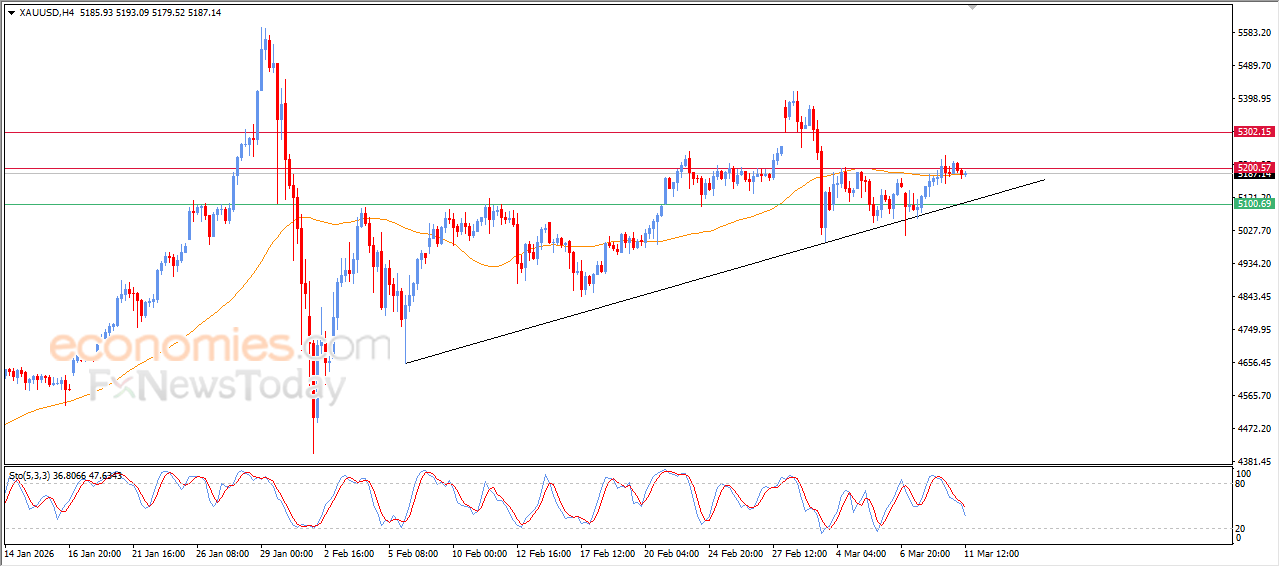
The price of gold is experiencing fluctuating trading on its last intraday levels, amid the stability of the key resistance at $5,200, attempting to gain bullish momentum that might help it to breach this resistance, leaning on EMA50’s support and under the dominance of bullish wave on short-term basis and its trading alongside supportive trend line for this path, besides the relative strength indicators’ reaching exaggerated oversold levels compared to the price move, indicating the beginning of forming positive divergence that intensifies the chances of moving higher.