Forecast update for Bitcoin -09-03-2026
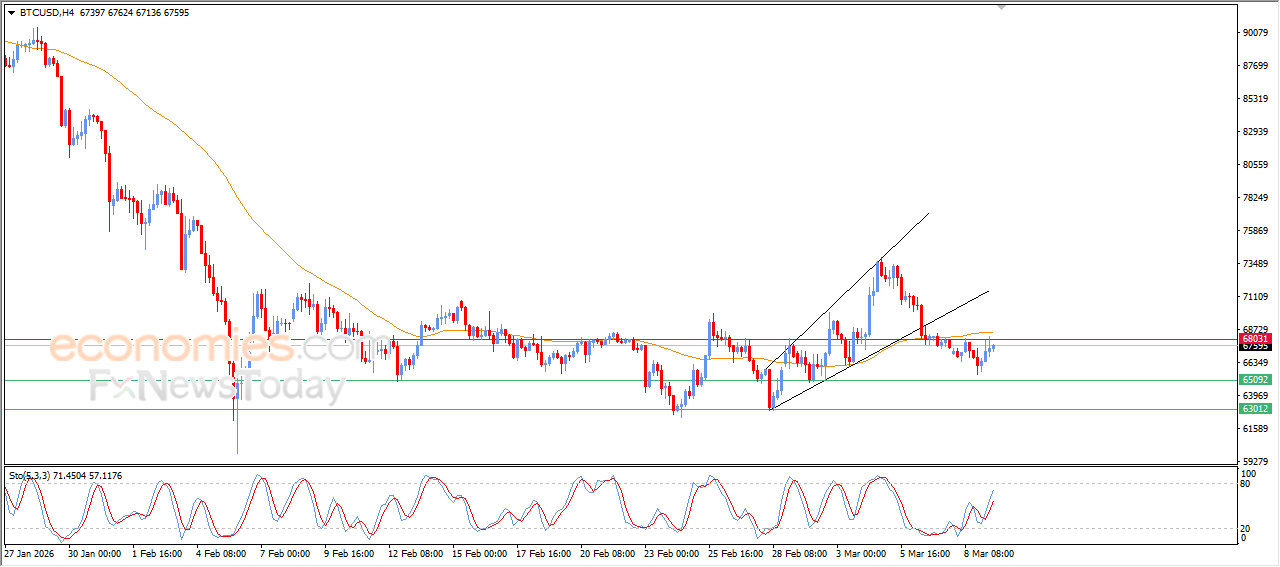
BTCUSD price rose in its last intraday trading, to retest the key resistance at $68,000, accompanied by reaching EMA50’s resistance, supported by the emergence of the positive signals from the resistance strength indicators, indicating a quick decline for the bullish momentum, affected by short-term negative technical formation that is represented by the broadening wedge pattern.
Forecast update for crude oil -09-03-2026
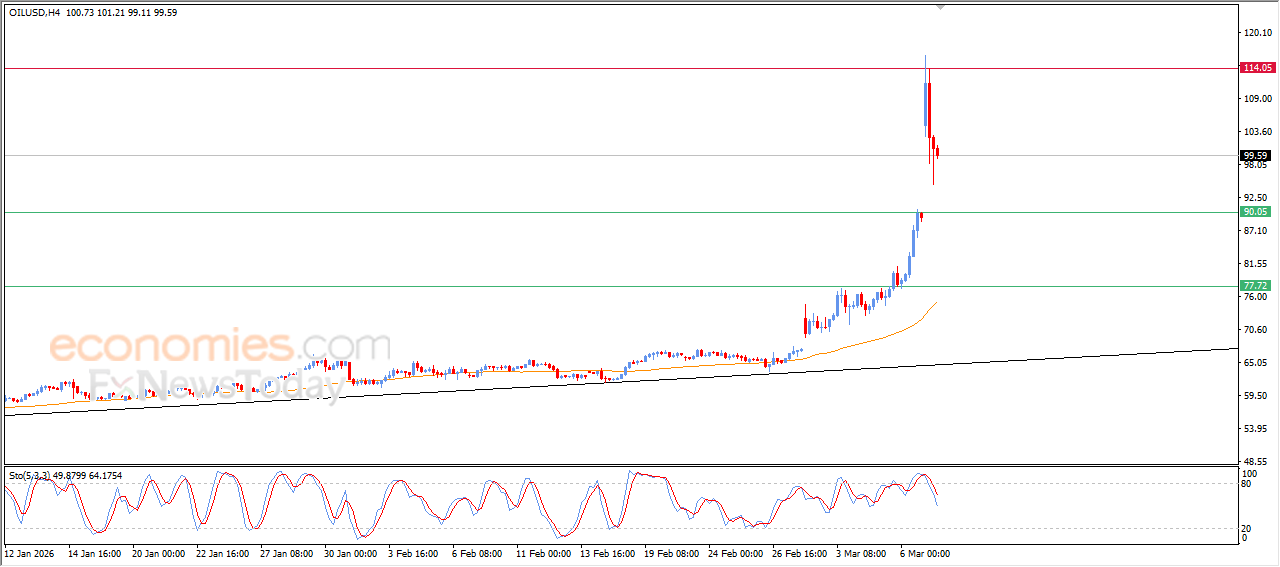
The price of (crude oil) declined in its last intraday trading, after reaching our morning suggested target at $114.00 resistance, to gather the gains of its last rises, attempting to look for higher low that might help it to gain bullish momentum for its recovery and rise again. The price is attempting to offload its overbought conditions on relative strength indicators, especially with the emergence of the negative signals from them, amid the dominance of the main bullish trend on short-term basis.
Forecast update for silver -09-03-2026
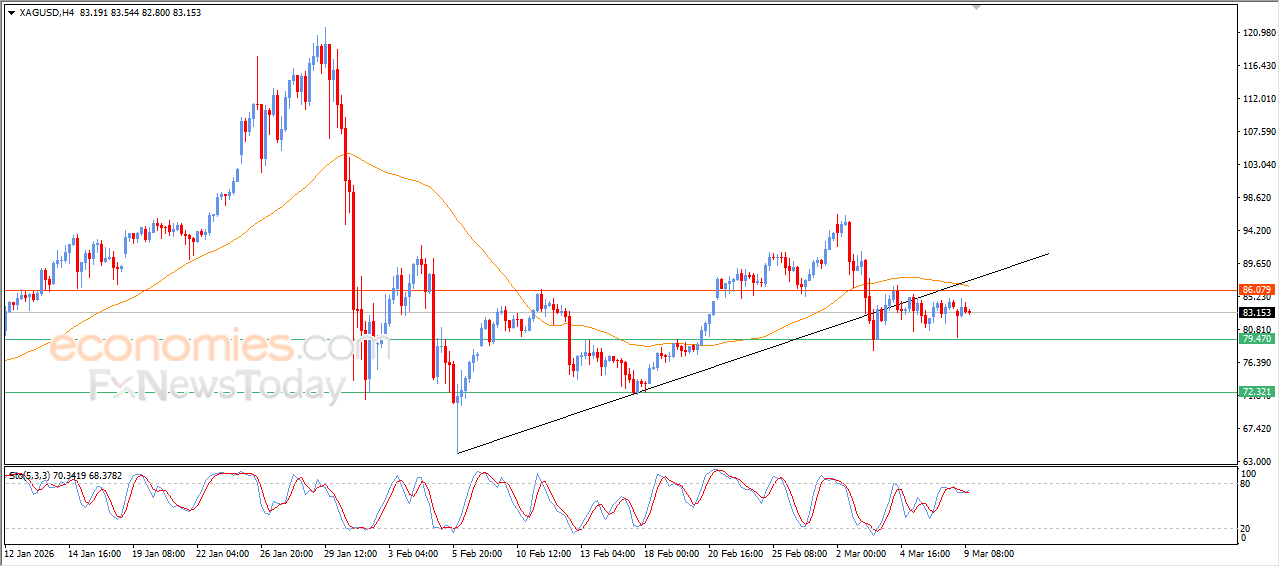
The price of (silver) is witnessing fluctuating trading that prefers moving lower in its last intraday trading, affected by breaking short-term bullish trend line, which weekend the chances of near-term recovery. The price faces increased negative pressures due to its stability below EMA50, which represents dynamic resistance that reinforces the selling pressure, on the other hand, we notice the emergence of negative signals from the relative strength indicators after reaching overbought levels, increasing the likelihoods of the decline continuation in the upcoming period.
Forecast update for gold -09-03-2026.
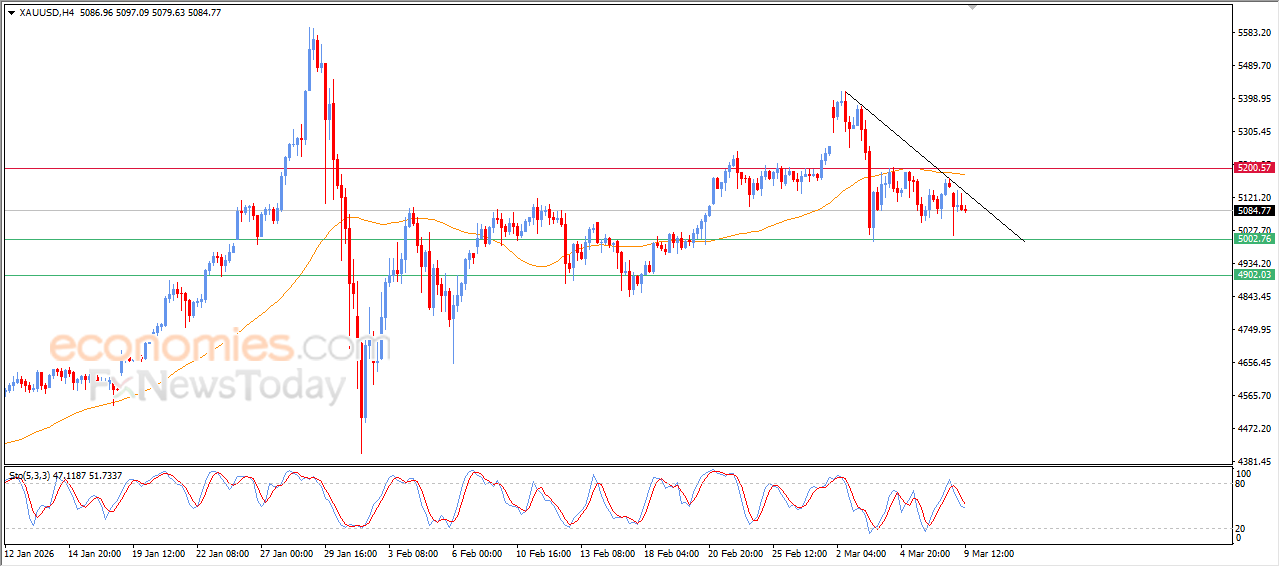
The price of gold declined in its last intraday trading, affected by the emergence of negative signals from the relative strength indicators, after forming negative divergence that reinforced the selling pressure, this decline comes amid the continuation of the trading below EMA50, which represents dynamic resistance that limits the opportunities of a recover, dominated by minor short-term bearish wave, accompanied by its trading alongside bearish bias trend that supports the continuation of this negative track.