Evening update for Bitcoin -10-03-2026
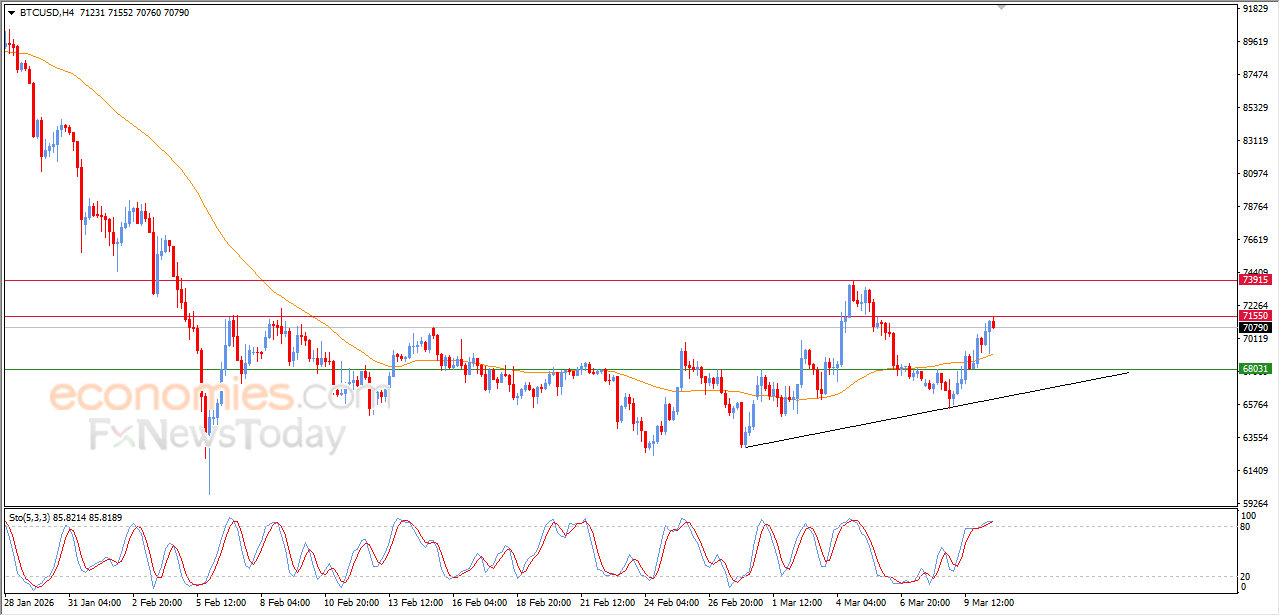
The (BTCUSD) price rose on its last intraday levels, reaching $71,500 resistance, which represents a potential target in our previous analysis, amid the dominance of bullish corrective wave on short-term basis, with its trading alongside supportive trend line for this path, taking advantage of the continuation of the dynamic pressure that is represented by its trading above EMA50, with the emergence of positive signals from the relative strength indicators, despite reaching overbought levels.
Evening update for crude oil -10-03-2026
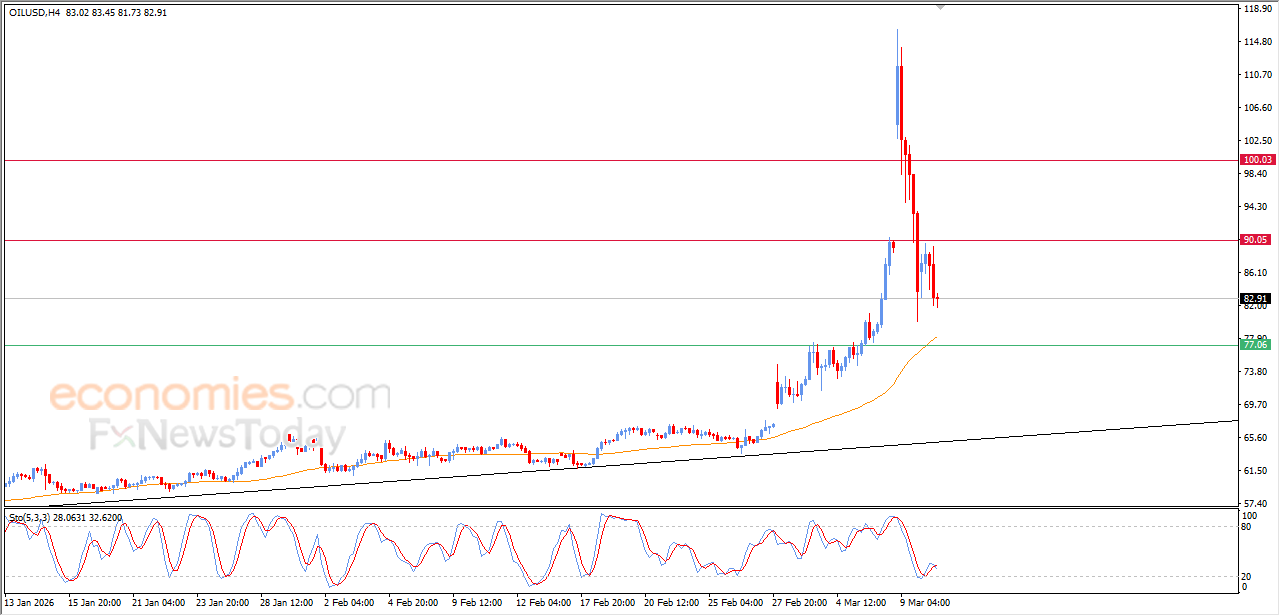
The (crude oil) price slipped lower in its last intraday trading, due to the stability of the resistance level at $90.00 amid the attempts of looking for a rising low to take it as a base that might help it to gain the required bullish momentum for its recovery, amid the continuation of the dynamic support that is represented by its trading above EMA50, with the emergence of the positive signals from relative strength indicators after reaching oversold levels.
Evening update for gold -10-03-2026
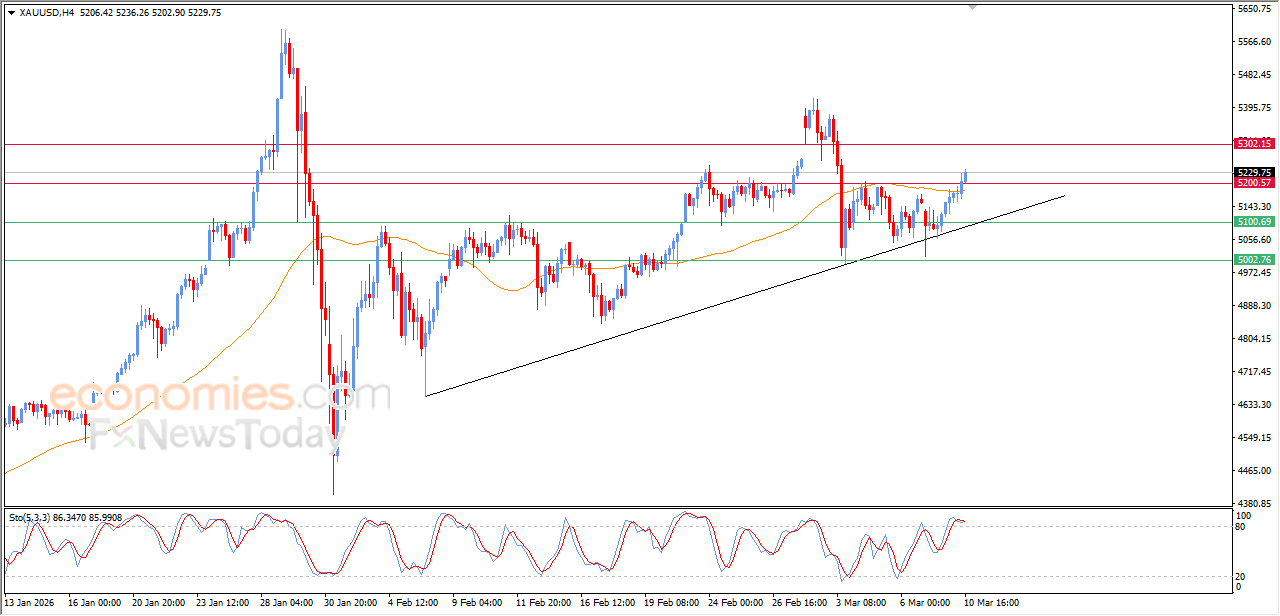
Gold’s price kept rising in its last intraday trading, to breach the main resistance at $5,200, accompanied by surpassing EMA50’s resistance, to get rid of its negative pressure, reinforcing the chances of extending its gains on near-term basis, amid the dominance of the bullish trend on short-term basis, with its trading alongside supportive trend line for this path, on the other hand, we notice the emergence of negative signals from the relative strength indicators, after reaching overbought levels, which might reduce its intraday gains.
Evening update for EURUSD-10-03-2026
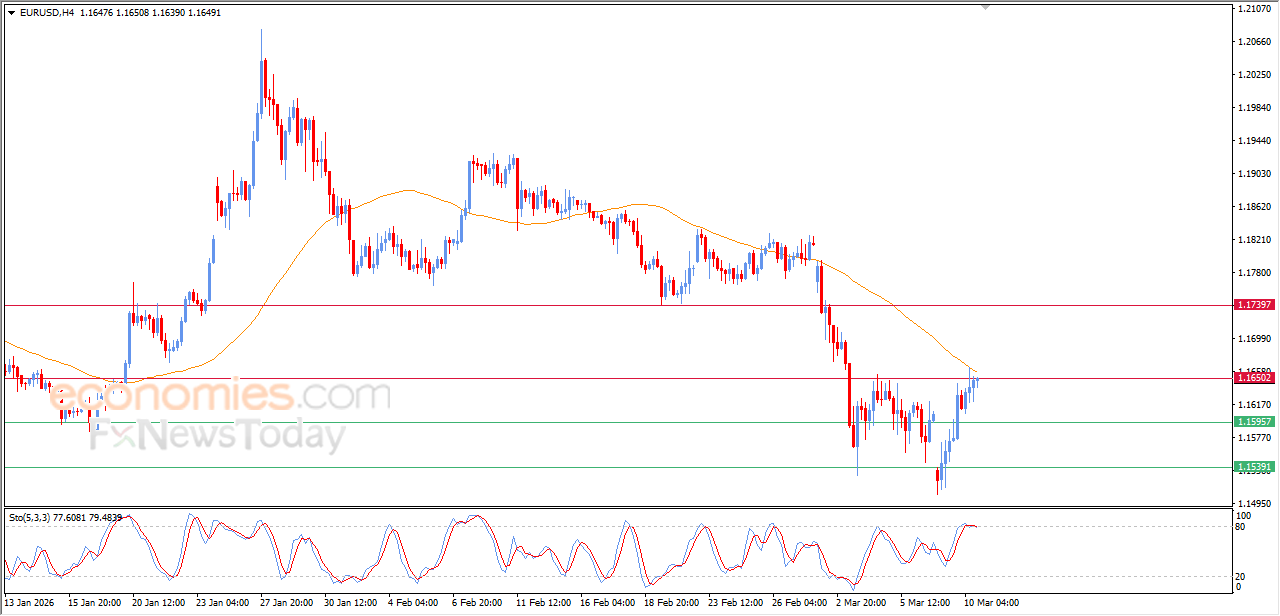
(EURUSD) kept rising in its last intraday trading, despite these gains, the pair fails now in breaching the key resistance at 1.1650, which represents a sign that show the weakness of the bullish momentum amid the continuation of the negative pressure due to its trading below EMA50, with the beginning of forming negative divergence on the relative strength indicators, after reaching overbought levels, exaggeratedly compared to the price move, with the emergence of the negative signals from there.