Cardano price suffers from negative pressures - Analysis - 19-11-2025
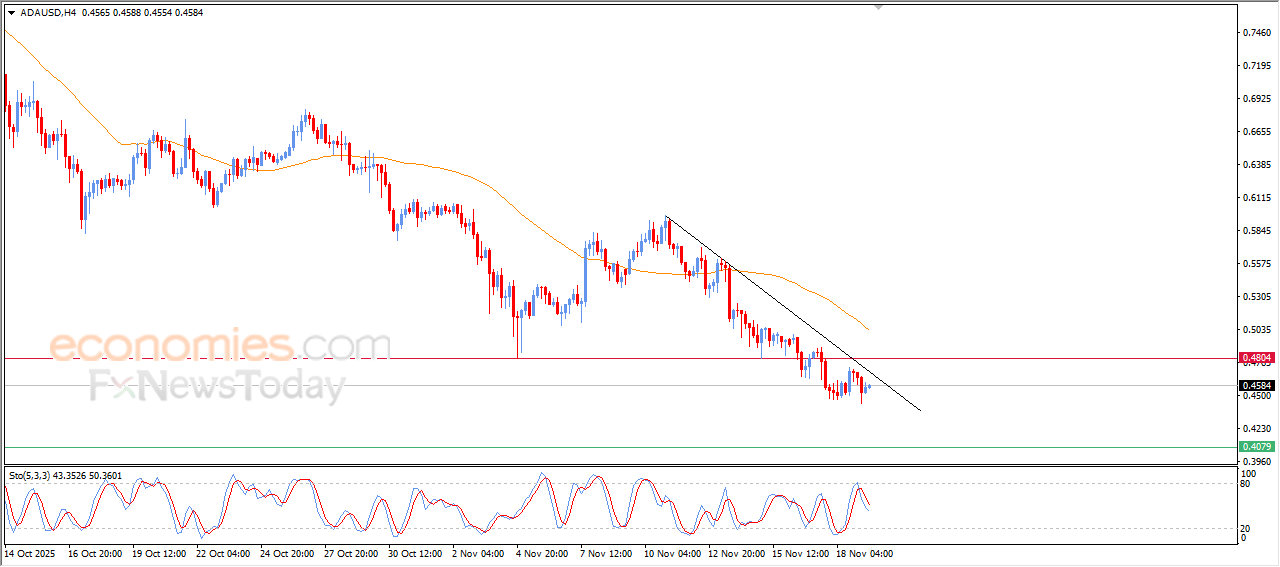
Cardano (ADAUSD) held lower in its latest intraday trading, pressured by continued movement below its 50-day simple moving average, which reinforces the dominance of the short-term primary downtrend, especially with price action moving along a descending secondary trendline. In addition, a negative divergence has formed on the RSI indicators after they reached excessively overbought levels relative to price movement, accompanied by renewed negative signals.
Therefore, we expect the cryptocurrency to decline in its upcoming intraday trading, as long as it remains below the resistance level of 0.4800, targeting the support level of 0.4080.
Today's price forecast: Bearish
Dash price dominated by downward correctional trend - Analysis - 19-11-2025
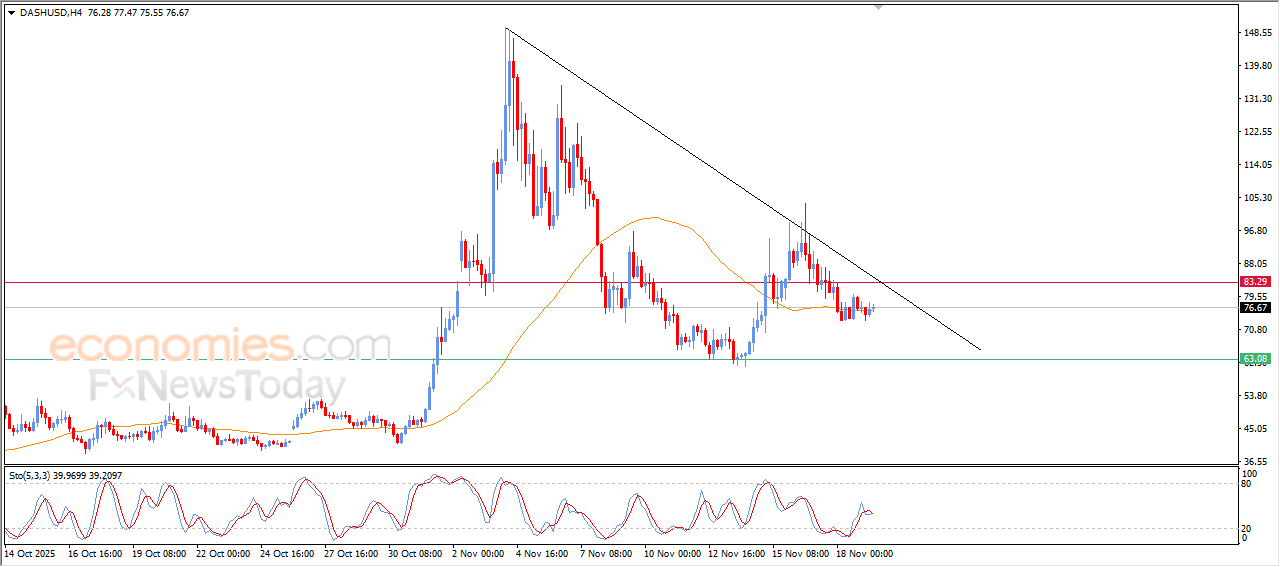
DASH saw choppy movement in its latest intraday trading, supported by its 50-day simple moving average, while the broader short-term corrective downtrend continues to dominate, with price action moving along a descending trendline. Meanwhile, RSI indicators have begun issuing negative signals after the price previously worked off its oversold conditions, adding further bearish pressure going forward.
Therefore, we expect the cryptocurrency to decline in its upcoming intraday trading, as long as it remains below the resistance level of 83.30, targeting the key support level of 63.00.
Today's price forecast: Bearish
Berkshire price driven lower by pivotal resistance - Forecast today - 19-11-2025
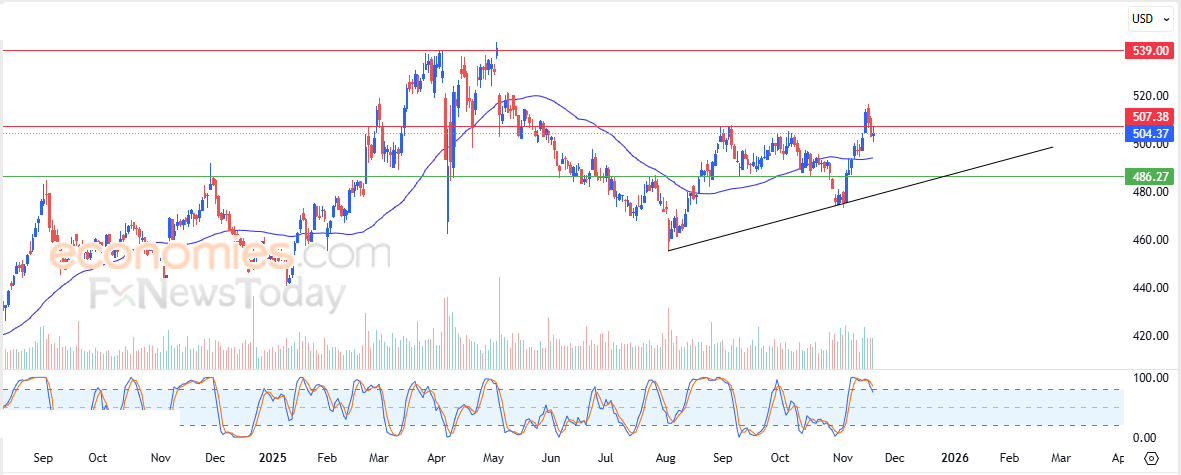
Berkshire Hathaway Inc. (BRK.B) edged lower in its latest intraday trading after the key resistance level of 507.35$ held firm. The stock is attempting to build positive momentum that could help it break above this barrier, while also trying to unwind some of its clear overbought conditions on RSI indicators, which have begun to send bearish signals. Despite this, the stock maintains dynamic support from trading above its 50-day simple moving average, within a prevailing short-term bullish trend aligned with an ascending minor trendline.
Therefore, we expect the stock to rise in its upcoming trading, especially if it breaks above the mentioned resistance level of 507.35$, targeting the next key resistance at 539.00$.
Today's price forecast: Bullish
Eli Lilly price soars - Forecast today - 19-11-2025
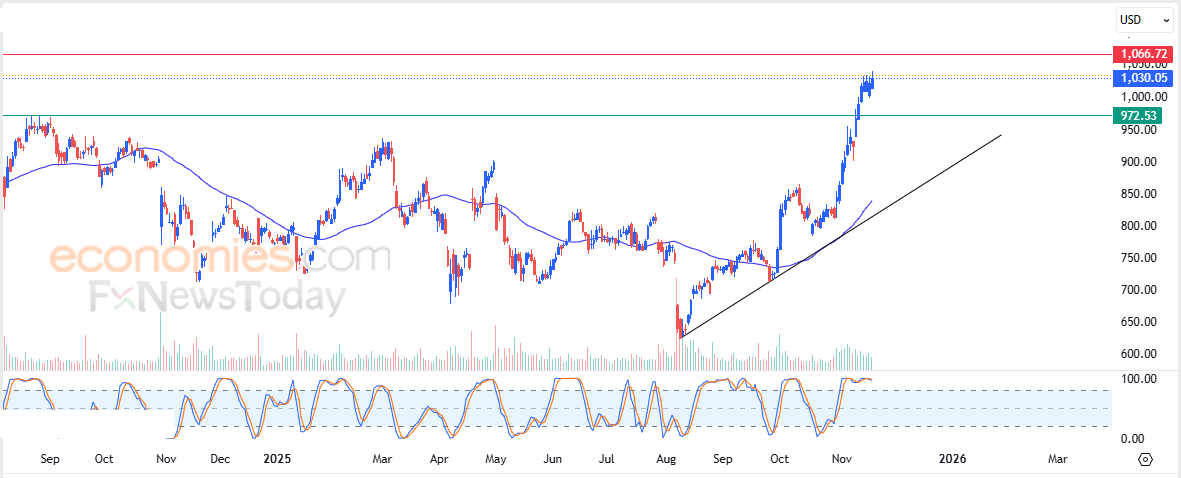
Eli Lilly and Company (LLY) rose in its latest intraday trading, with a strong bullish trend firmly dominating the short-term outlook as the stock continues to move alongside an ascending trendline. This upward momentum is supported by sustained trading above the 50-day simple moving average. However, RSI indicators have begun to show a bearish crossover after reaching extremely overbought levels, which could limit the stock’s upcoming gains.
Therefore, we expect the stock to rise in its upcoming trading as long as it remains above the support level of 972.50$, targeting the first resistance level at 1,066.00$.
Today's price forecast: Bullish