


 |
|
Bitcoin (BTCUSD) moves in a tight sideways range trading -Analysis-15-05-2025
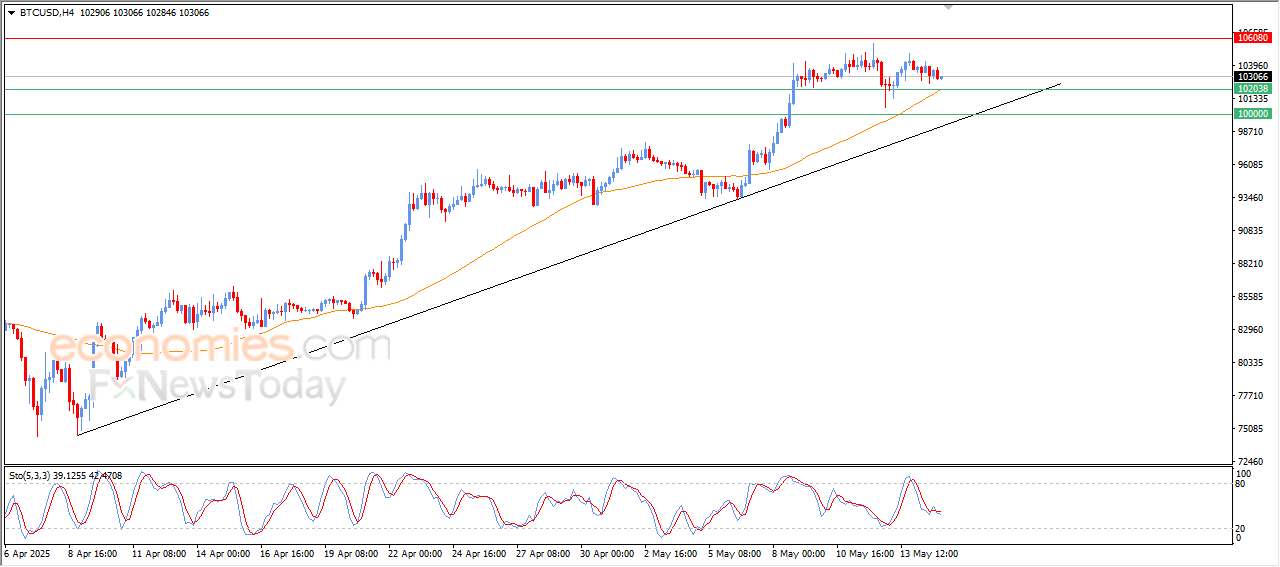
Bitcoin price(BTCUSD) declined in its recent intraday trading, affected by a negative pressure due to the emergence of the negative signals on the (RSI), with its trading in a tight sideways range trading, which targets gaining the required positive momentum to recover, amid the dominance of the main bullish trend on the short-term basis and its trading alongside a bias line, with the continuation of the dynamic support due to its trading above its EMA50.
Crude oil exhausted its positive opportunities -Analysis-15-05-2025
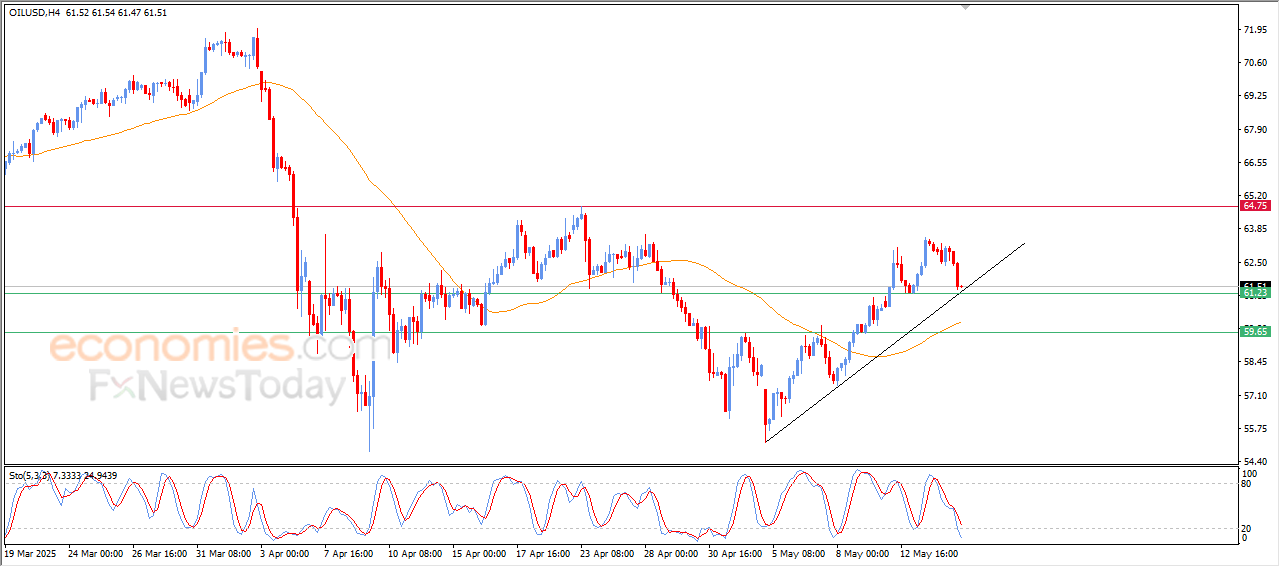
Crude oil price declined in its recent intraday trading, with the emergence of the negative signals on the (RSI), despite reaching oversold levels, to lean on a bullish correctional trend line on the short-term basis, accompanied by its lean on the critical support level at $61.25, in a last attempt to look for a rising bottom to take it as a base that might assist it to gain the required momentum to recover, with the continuation of the positive pressure due to its trading above its EMA50.
MoreGold settles bearishly -Analysis-15-05-2025
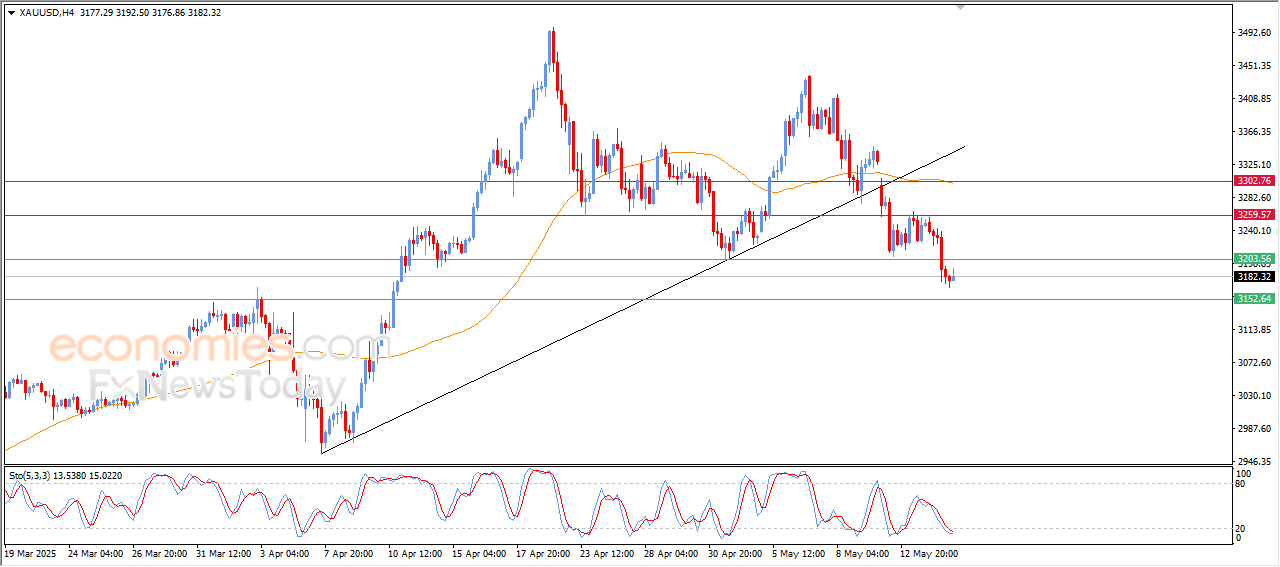
The Gold price rose in its recent intraday trading, in attempt to recover some of its previous losses, amid the dominance of the bearish correctional trend on the short-term basis, with its stability below the main level at $3,200, and the price suffers from the continuation of the negative pressure due to its trading below its EMA50, accompanied by the emergence of the negative signals on the (RSI), despite reaching oversold levels.
MoreThe EURUSD is under negative pressure -Analysis-15-05-2025
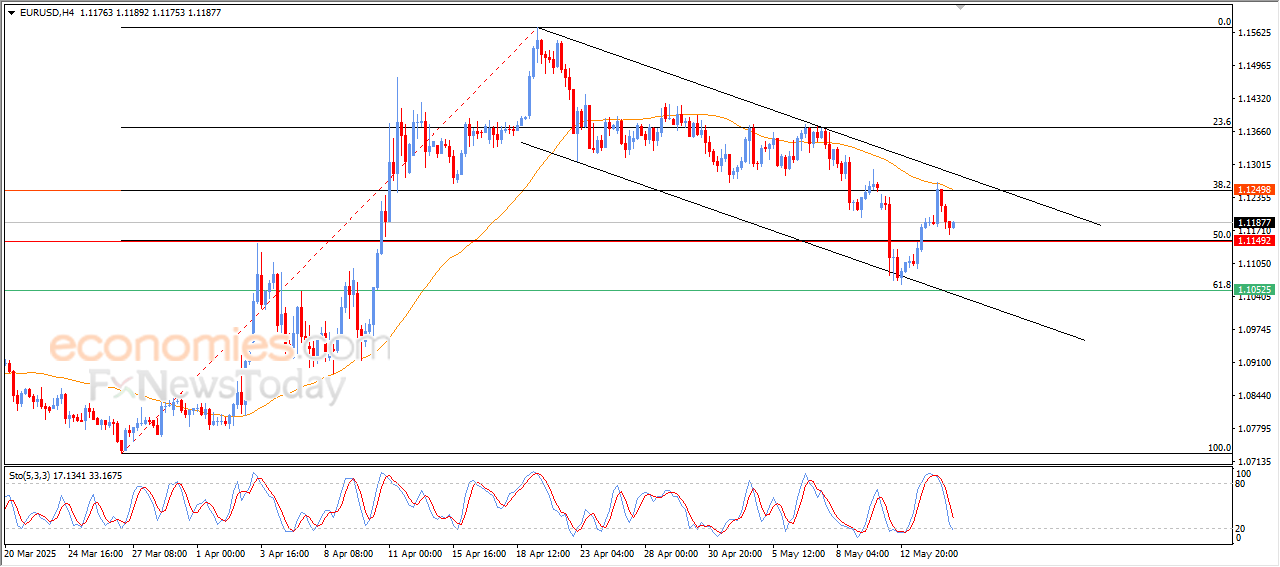
The (EURUSD) price settled downside in its recent intraday trading, under the dominance of the bearish correctional trend within price channel, with the emergence of the negative signals on the (RSI), besides its stability below the resistance of 1.1250, this level represents 38.2%Fibonacci correction level for the last bullish wave on the short-term basis(from 1.0730 to 1.1572), and the price suffers from the continuation of the negative pressure due to its trading below its EMA50.
More