Bitcoin (BTCUSD) is experiencing well deserved profit taking- Analysis-26-02-2026
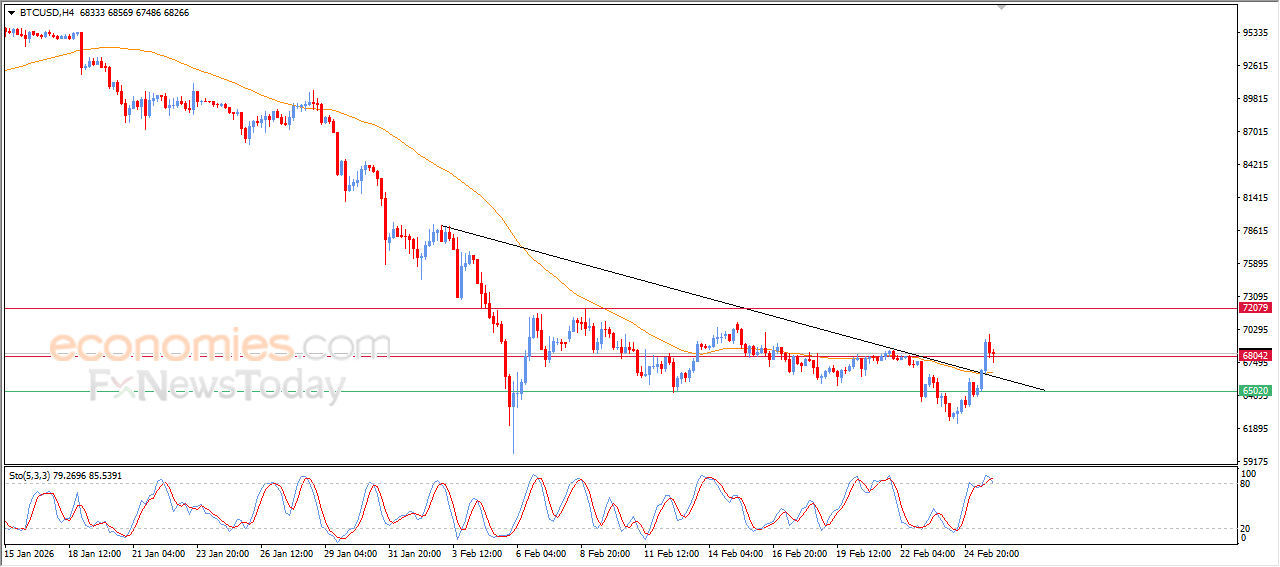
Bitcoin’s price (BTCUSD) declined in its recent intraday trading in natural profit taking phase after previous bullish wave, with its attempts to reduce its clear overbought conditions on relative strength indicators, especially with the emergence of negative overlapping signals, indicating short-term corrective pressures.
Despite this decline, the technical overview remains positive, affected by breaching minor bearish trend line on short-term basis, besides surpassing the negative pressure due to the trading below EMA50, providing chance for gathering momentum and resuming its gains if the indicators settle.
Crude oil prices are experiencing cautious recovery amid supportive technical signals- Analysis- 26-02-2026
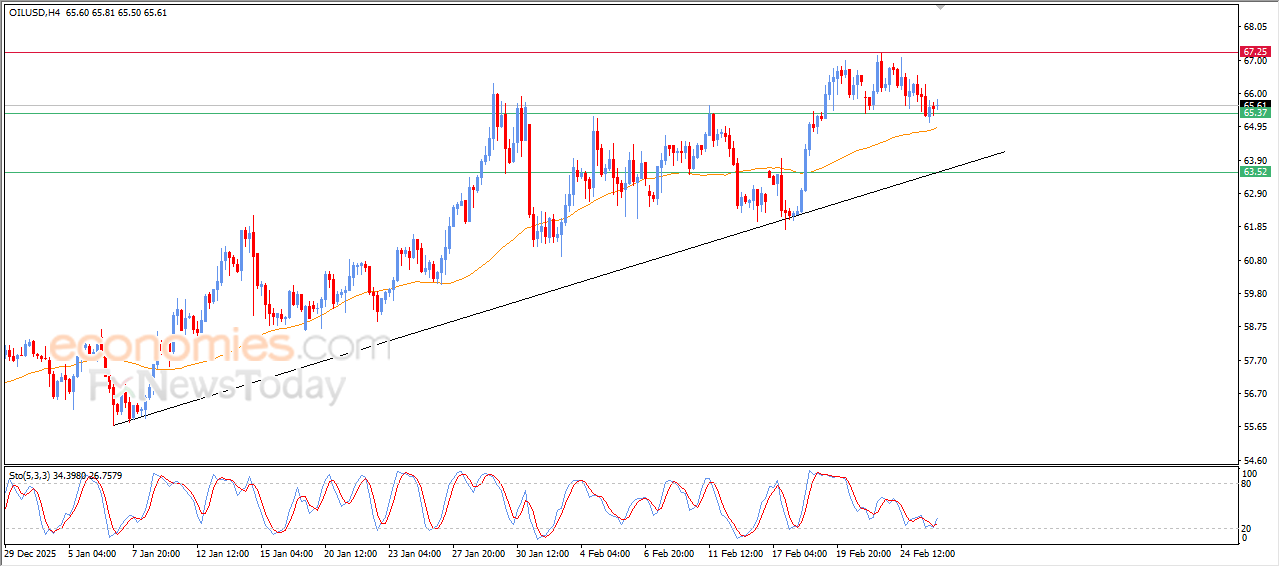
Crude oil prices rose slightly in their last intraday trading, supported by the stability of the key support at $65.35, providing positive technical momentum that reinforced by its trading above EMA50, amid the dominance of the main bullish trend on short-term basis, with the trading alongside supportive trend line that indicates the stability of the current positive technical structure.
On the other hand, the relative strength indicators began showing new positive signals, after reaching sever oversold levels compared to the price move, which supports the likelihoods of recovery continuation in the near period, unless sudden selling pressures appear to obstruct this momentum.
Silver Price gets ready to attack key resistance– Analysis-26-02-2026
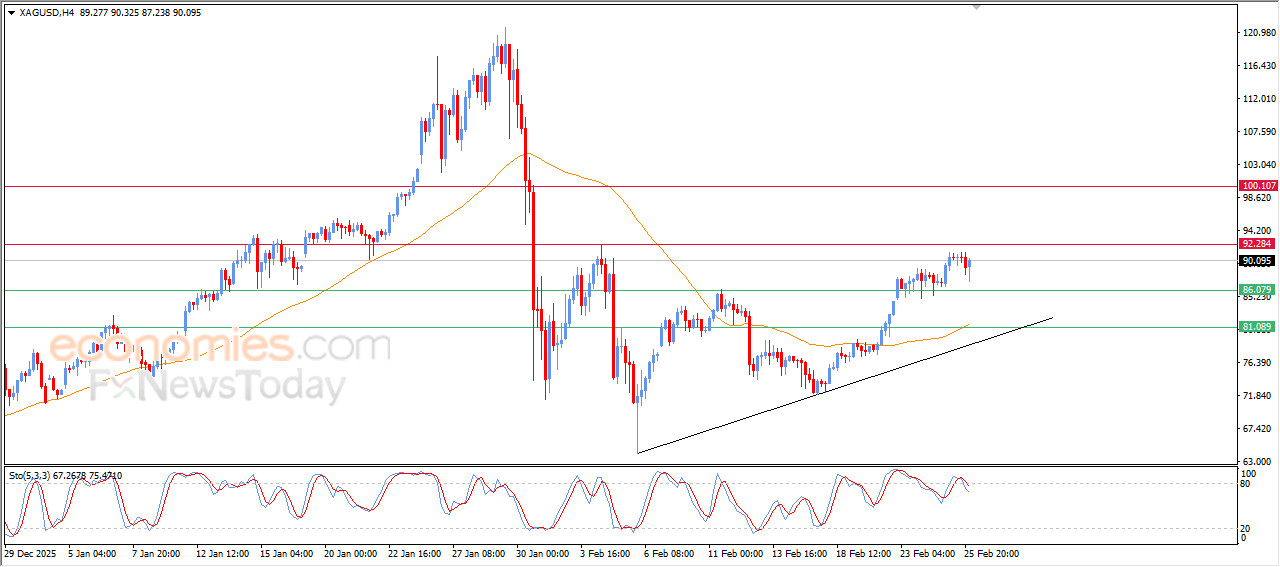
Silver prices rose in their last intraday trading, approaching from resting $92.00 key resistance, amid the continuation of the positive support that comes from its stability above EMA50, indicating the dominance of the bullish corrective trend on short-term basis, it gives the price a degree of technical stability.
There are some warning signals, and negative divergence on relative strength indicators, accompanied by the emergence of new bearish signals, which might limit the ability of breaching the mentioned resistance and push it to enter limited corrective move on near-term basis.
Gold prices keep their bullish track- Analysis-26-02-2026
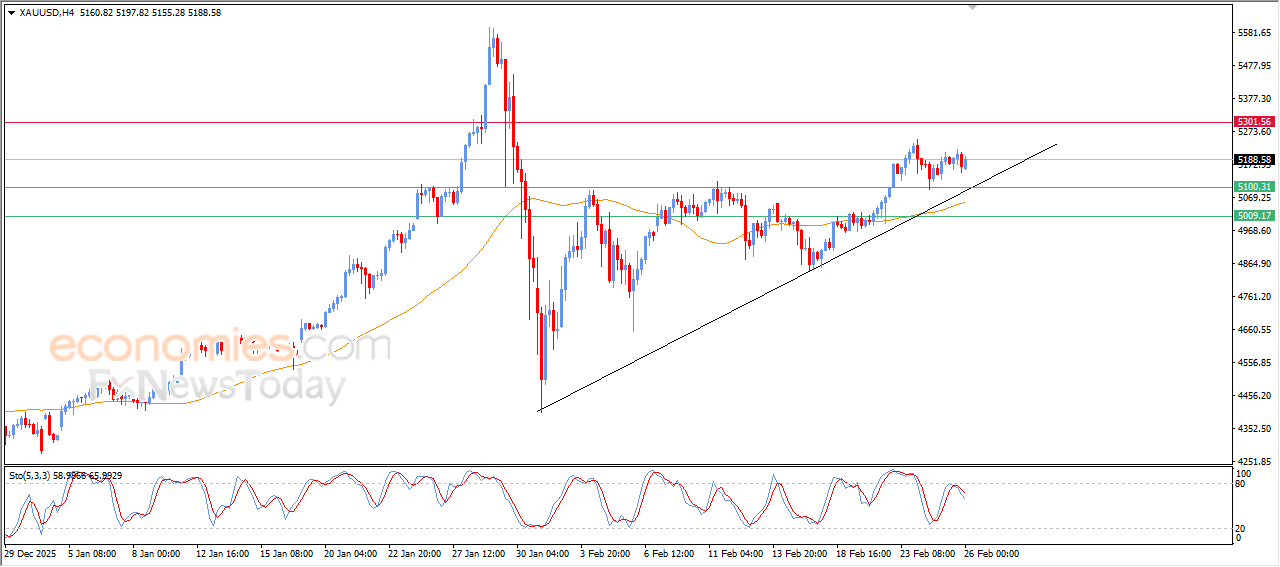
Gold price rose during its recent intraday trading, keeping its fluctuated moves in sideways range to gather the required bullish momentum for resuming the rise, amid the dominance of minor bullish wave on short-term basis, with organized trading alongside supportive trend line for this path, besides the trading above EMA50, which provides dynamic support that reinforces the stability of the trend.
On the other hand, the relative strength indicators began to show negative signals after reaching overbought levels, which might indicate a temporary slowness in the bullish momentum and limits the upcoming gains.