Bitcoin (BTCUSD) declines after reaching our expected target- Analysis-15-04-2026
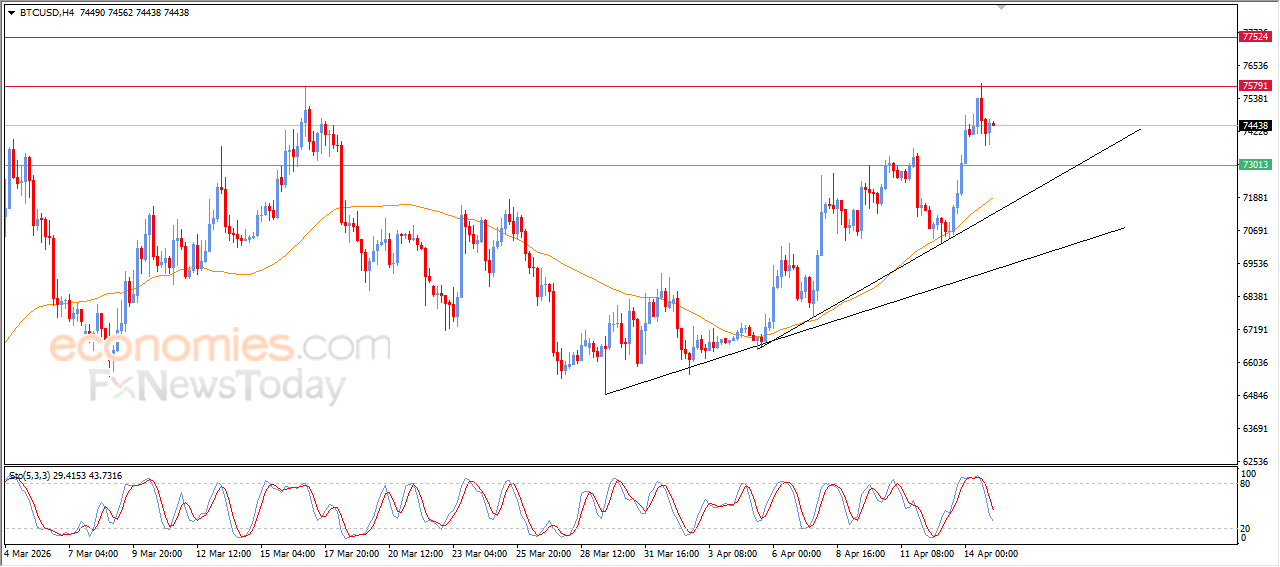
Bitcoin (BTCUSD) settles lower in its latest intraday trading after holding below the key resistance level at $75,500. This level was a price target in our previous analysis, and the decline reflects a natural profit-taking phase following earlier gains.
The price managed to ease its overbought condition on the relative strength indicators, regaining some positive momentum that could help it to breach this resistance. This comes as Bitcoin continues to trade above EMA50, which provides dynamic support and reinforces the stability and dominance of the main short-term bullish trend, especially with trading alongside major and minor supportive trend lines.
Crude oil prices reach our target - Analysis- 15-04-2026
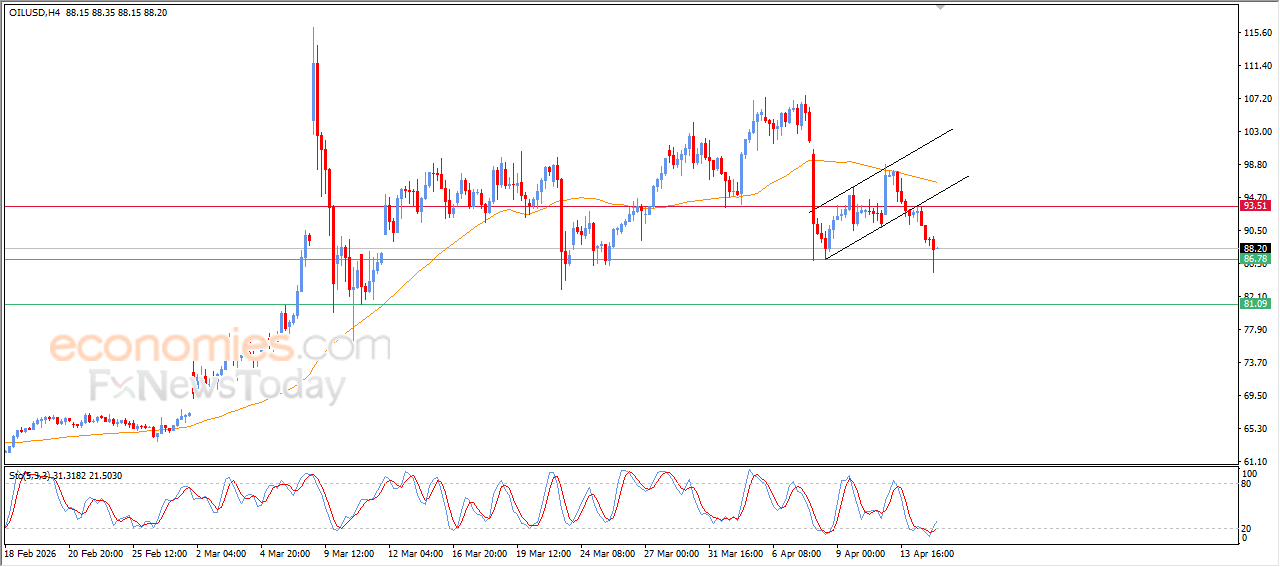
Crude oil prices continued to decline during recent intraday trading, reaching and stabilizing near the key support level at $87.00. This level had been a target in our previous analysis and provided the price with some positive momentum, allowing it to rebound slightly and trim part of its losses. The price is also attempting to relieve its clearly oversold condition on the relative strength indicators, especially with the emergence of early positive signals.
MoreSilver price surpasses our price target - Analysis- 15-04-2026
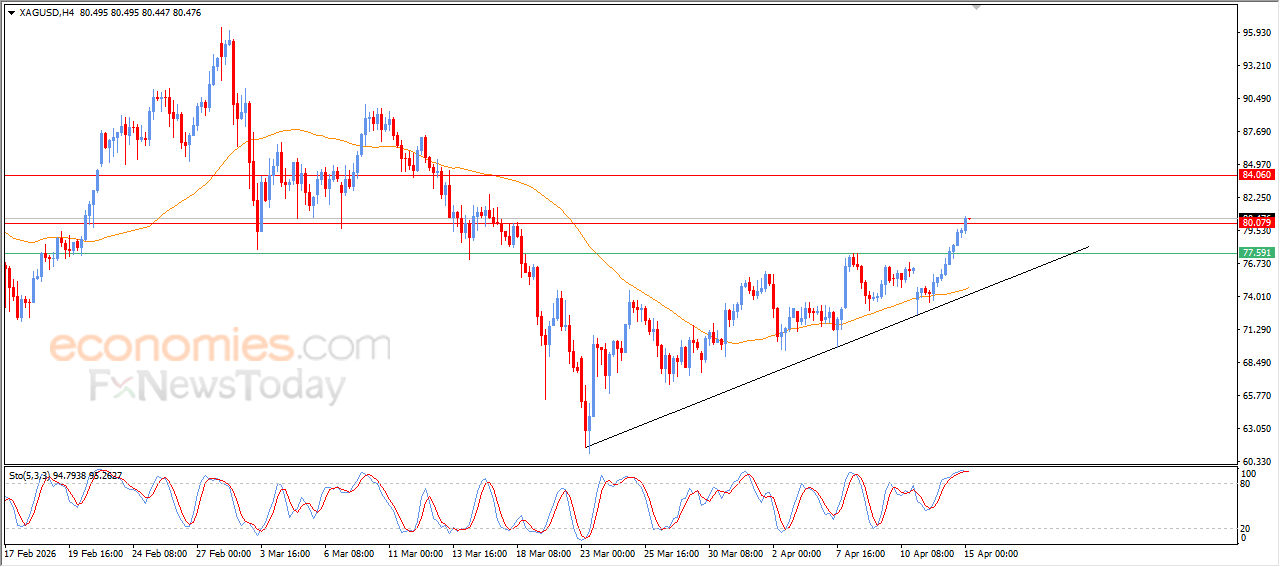
Silver continued its upward movement during recent intraday trading, surpassing the key resistance level at $80.00. in a technical step that confirms the breach and supports the continuation of the short-term corrective bullish trend. This performance comes as the price remains stable above EMA50, which continues to provide dynamic support and strengthen the bullish momentum.
MoreGold price breaches a key resistance - Analysis-15-04-2026
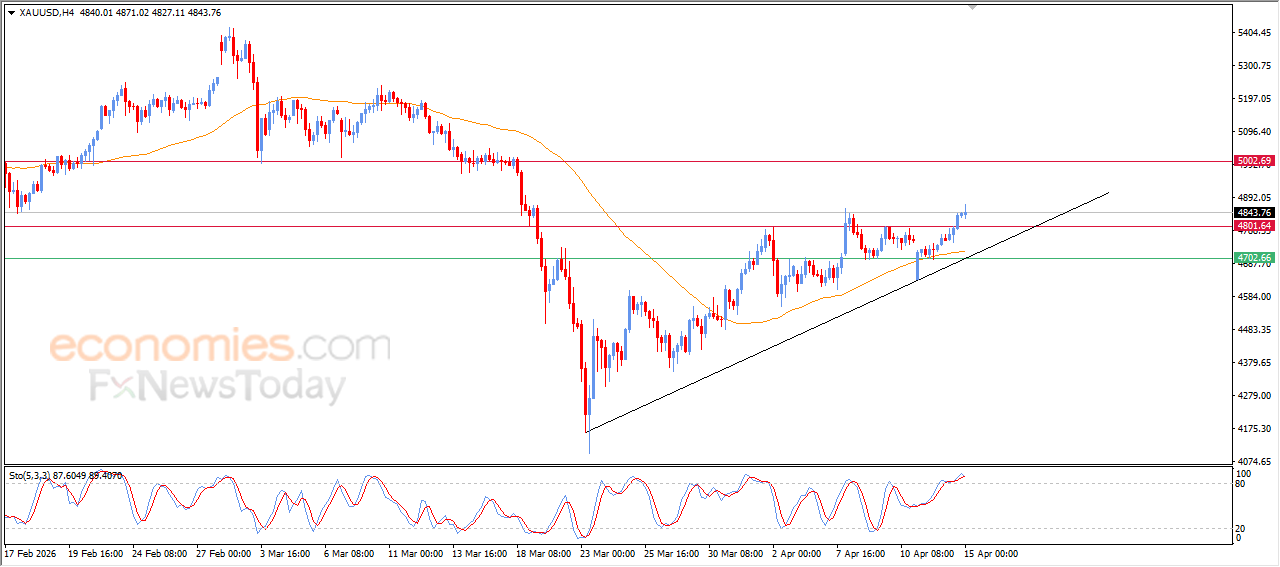
Gold rose during its latest intraday trading, confirming a breakout above the strong resistance level at $4,800. This move is a technical signal reflecting strong bullish momentum and the price’s readiness to continue climbing. The positive movement is supported by price action along a short-term ascending corrective trendline, in addition to its stability above EMA50, which continues to provide dynamic support and reinforces the chances of further gains.
More