(BTCUSD) is reaching our expected target- Analysis-16-12-2025
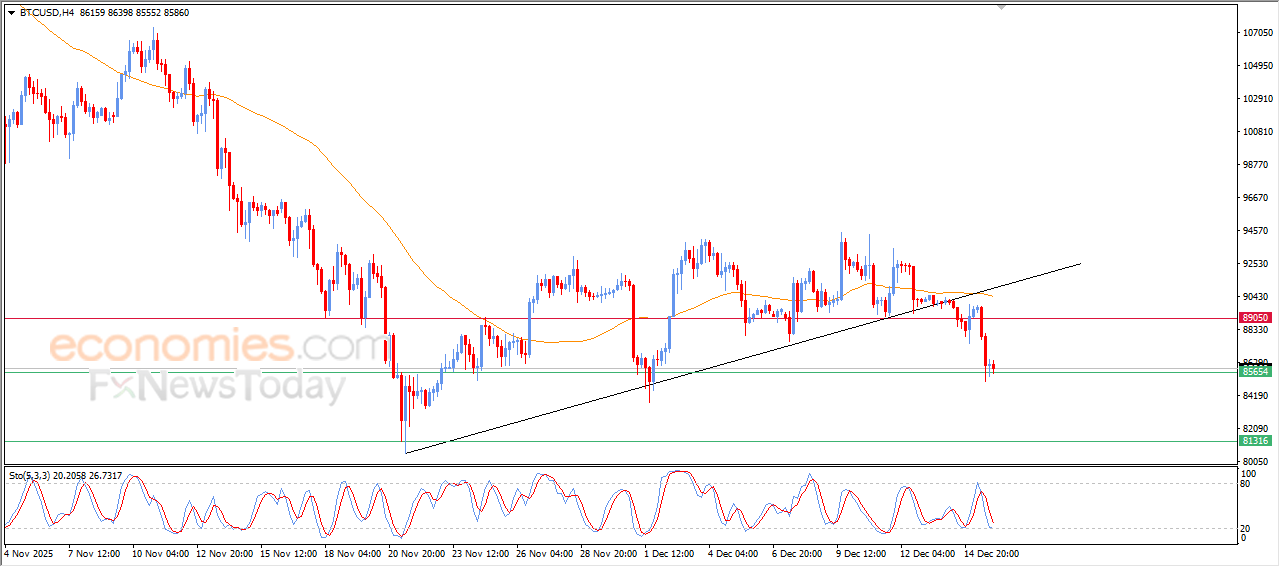
Bitcoin’s price declined in its last intraday trading, affected by the emergence of the negative signals on the relative strength indicators, despite reaching oversold levels, reaching the key support at $85,500, which represents expected target in our previous analysis, indicating the continuation of the selling pressures on the short-term basis.
This decline comes amid the continuation of the negative pressure due to its trading below EMA50, affected by breaking bullish corrective trend line on a short-term basis, reinforcing the likelihoods of breaking the current support and opening the way for more intraday declines.
Crude oil prices are getting ready to break our expected target- Analysis-16-12-2025
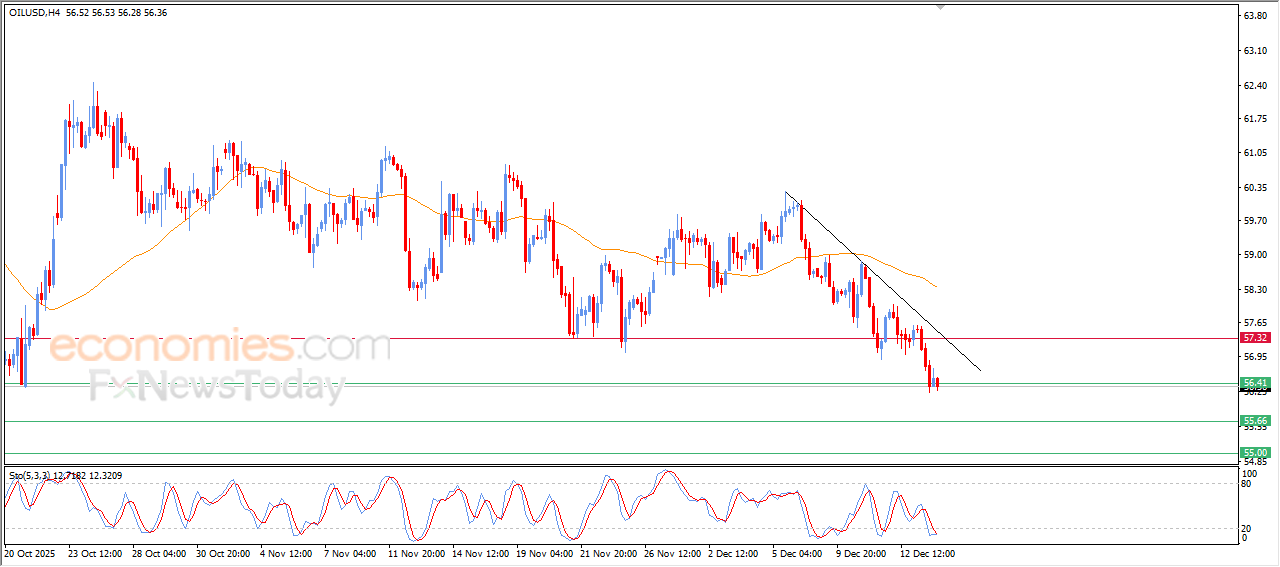
Crude oil continued its decline in its recent intraday trading, to reach $56.40 key support, which represents potential target in our previous analysis, to become threatened by breaking this support, amid the continuation of the negative pressure that comes from its trading below EMA50, and under the dominance of the main bearish trend and its trading alongside supportive minor trend line for this track.
MoreGold price is rising slightly- Analysis-16-12-2025
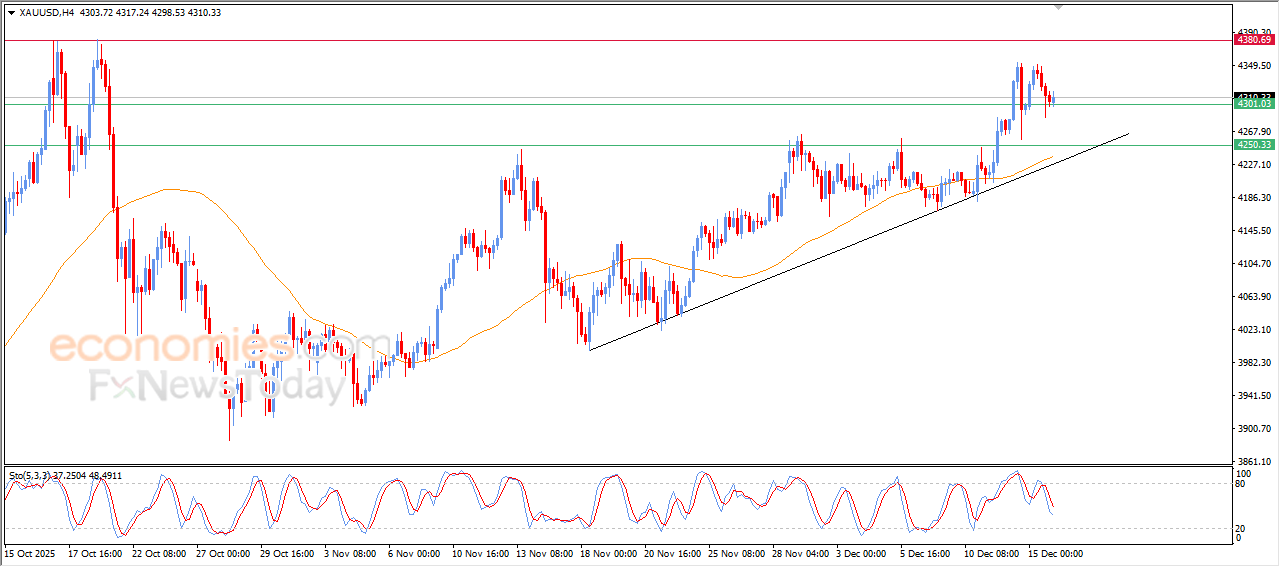
Gold rose slightly in its recent intraday trading, taking advantage of the stability of the main support at $4,300, gaining initial bullish momentum that reinforce by its trading above EMA50, amid the dominance of the main bullish trend on the short-term basis and its trading alongside supportive trend line for this track.
MoreEURUSD price is experiencing fluctuating trading-Analysis-16-12-2025
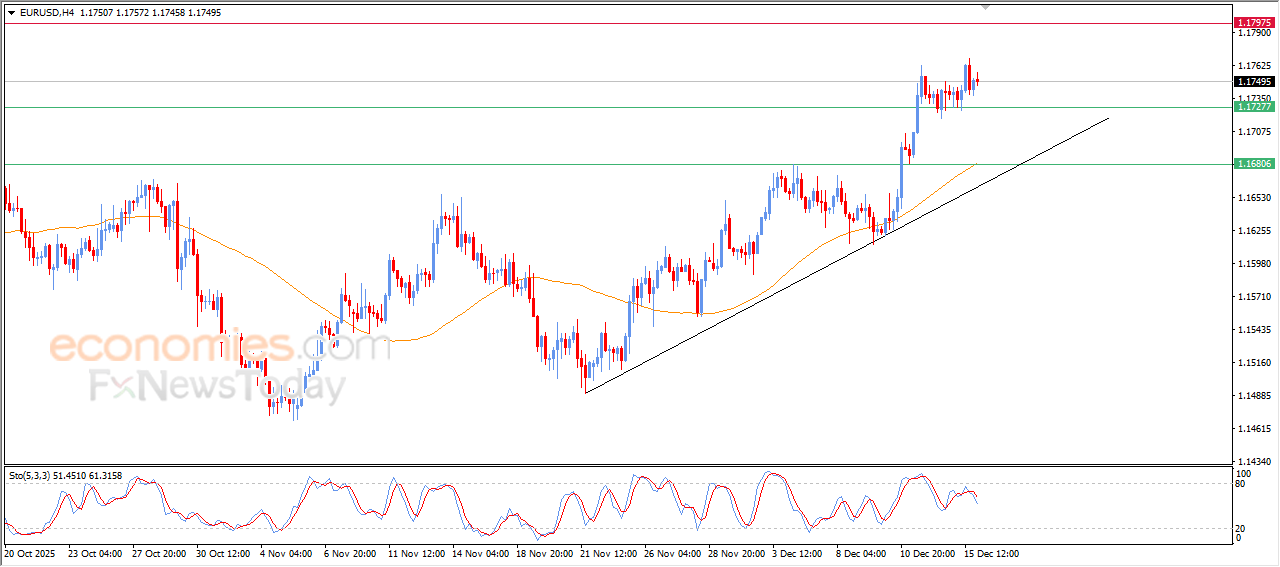
The (EURUSD) price kept attempting to gain bullish momentum in its last intraday trading, amid the dominance of the main bullish trend on the short-term basis, and the trading alongside supportive trend line, depending on the dynamic support that is represented by its trading above EMA50.
More